

How can I measure high quality scanning probe electrochemistry maps?
Latest updated: May 20, 2026Introduction
We are often asked for the tricks required to obtain high quality images when using the scanning probe electrochemistry techniques, like Scanning Electrochemical Microscopy (SECM), and Scanning Vibrating Electrode Technique (SVET). Although each technique will have its own settings to control the quality of the measurement, there are some settings which are universal across the entire technique family. In this article we introduce universal factors which can influence the scanning probe electrochemistry experiment. By understanding how these universal factors affect the area scan, and how they can be tuned to produce a high-quality image, readers will see no tricks are needed. The universal factors influencing the scanning probe electrochemistry experiment are:
- Size of the probe
- Probe to sample distance
- Sample tilt and topography
- Scan type
- Scan rate
- Step size
Size of probe
Regardless of the scanning probe electrochemistry technique the size of the probe (or droplet in the case of Scanning Droplet Cell (SDC)) controls the resolution, and therefore the sharpness of the final area scan. The smaller the probe the higher the resolution of the measurement, with it possible to resolve smaller features. When the same feature is measured by two different sized probes the image of that feature will be sharper for the smaller probe. This is apparent in area scans performed by a 10 and 1 µm SECM probe, Fig. 1. Distinct circular active regions, with clear edges are seen when the 1 µm probe is used, however, when the 10 µm probe is used there is overlap between the signals of neighboring active regions, and fuzzy edges even for separated features. It is important to note that the signal is typically smaller when smaller probes are used. If this is not accounted for during the setup, e.g. by changing the current range/sensitivity, and/or using a Faraday cage, the resulting signal could be poor.
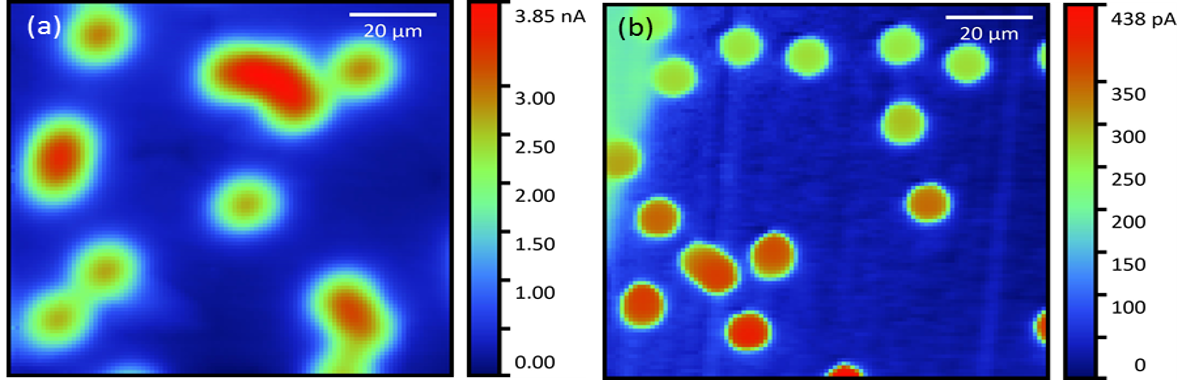
Figure 1 : Comparison of the area scan produced by a 10 µm (a) and a 1 µm (b) SECM probe. Features are 12 µm pores of a membrane over Au.
Probe to sample distance
The probe to sample distance is important in all scanning probe experiments, not just those used to measure local electrochemistry. The probe must be close enough to measure a good signal, but not so close that the probe could contact the sample during measurement. The ideal distance will depend on the specific technique used. For all techniques, however, if the probe is too far from the sample surface the signal quality will decay. The decay can be apparent as a weaker signal, a noisier signal, a less well-defined feature and more. Fig. 2 shows the effect of increasing the probe to sample distance from the ideal 100 µm for SVET all the way to 2100 µm, in which the signal becomes weaker, noisier, and broader with increasing distance.
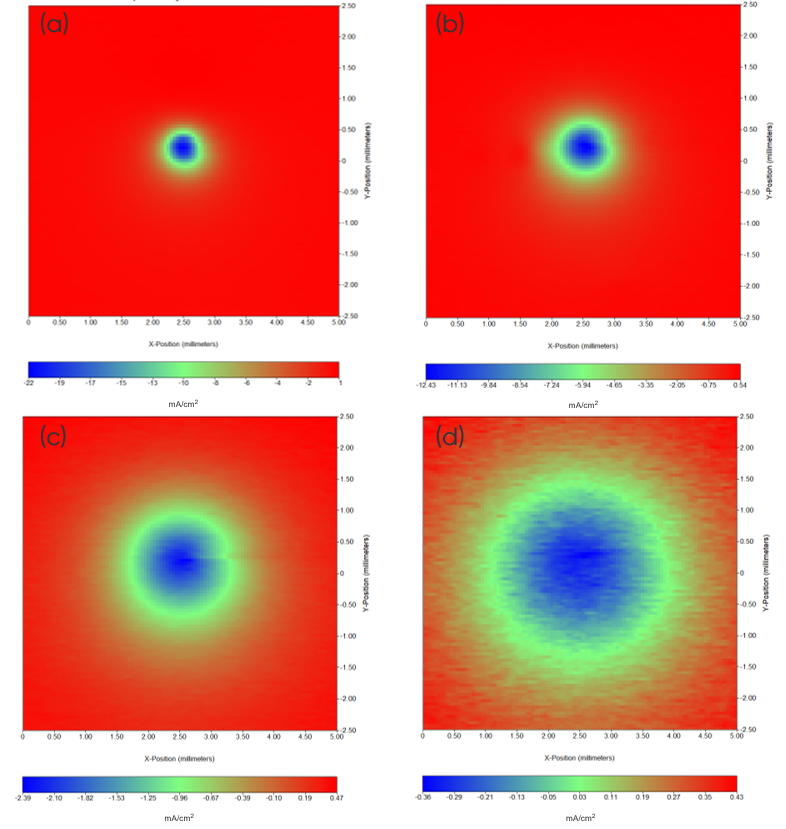
Figure 2 : Illustration of the effect of increasing probe to sample distance on a SVET measurement. The probe to sample distance increases from 100 µm (a), to 350 µm (b), to 1100 µm (c), and finally to 2100 µm (d).
For SDC the probe to sample distance is important, however, because the droplet can stretch, increasing the probe to sample distance does not necessarily cause the signal to deteriorate, but instead the droplet contact can break causing the signal to disappear completely, Fig. 3.
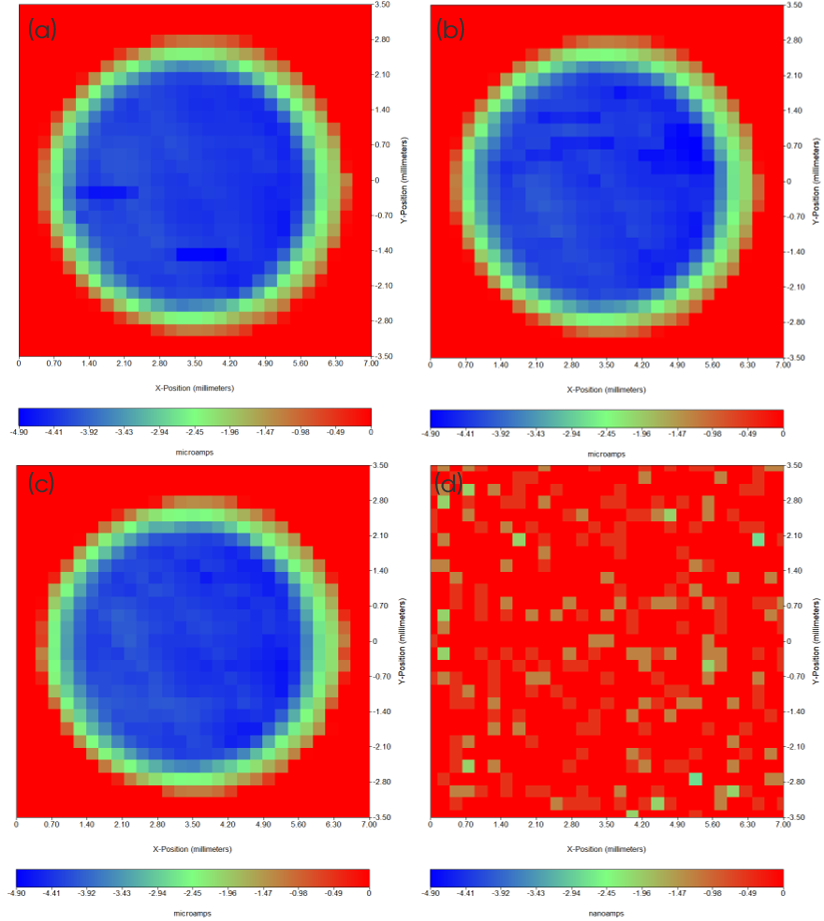
Figure 3 : Illustration of the effect of increasing probe to sample distance on an SDC measurement. The probe to sample distance increases by 25 µm from (a) to (b), 50 µm from (b) to (c), and 100 µm from (c) to (d).
Sample tilt and topography
Because the probe to sample distance is so influential on scanning probe electrochemistry measurements, any background topography, including sample tilt, can have a noticeable effect on the measured signal. When the probe moves to a region with a large probe to sample distance the signal will decay as we have seen in the last section. An example of this is shown for an SECM experiment in Fig. 4.
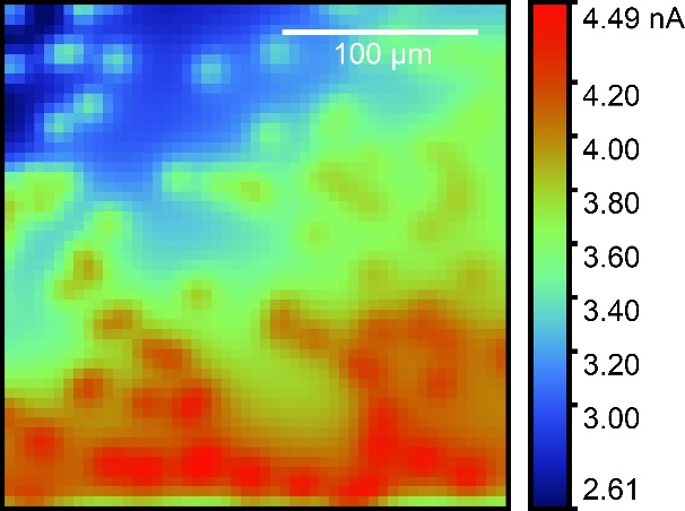
Figure 4 : The effect of sample tilt on the SECM experiment is shown.
Again, for SDC the effect is different to other techniques, with large topography changes, e.g. tilt, the droplet contact can break causing a complete loss of signal, Fig. 5.
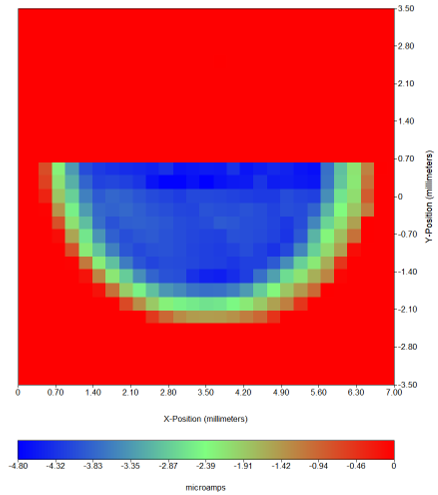
Figure 5 : The effect of sample tilt on the SDC experiment is shown.
There are means to counteract the sample topography. Prior to the experiment the sample should be carefully levelled, to avoid the sample being tilted in the first place. This is not always possible to fully achieve, so in those cases where there is minor tilt users can counteract its effects by using the “Tilt Correction” function available in the M470 software, as illustrated for Scanning Kelvin Probe (SKP) in Fig. 6.
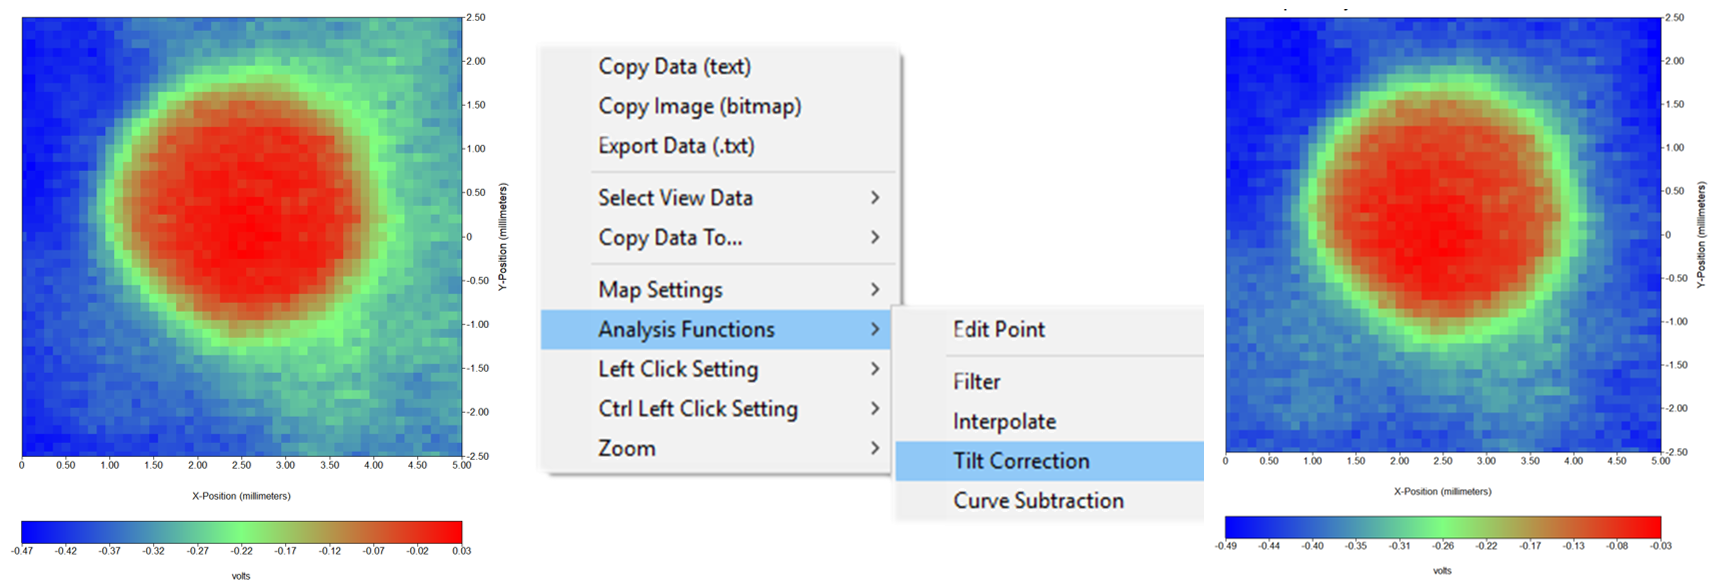
Figure 6: The use of the Tilt Correction function on a tilted SKP experiment is shown.
In cases where the topography is too large to overcome by levelling or post experiment tilt correction it is possible to perform a height tracking measurement, in which the topography of the sample is measured, or extrapolated, in a previous experiment, and then followed during the local electrochemistry experiment of interest. The effects of using a height tracking measurement can be seen for a SVET experiment in Fig. 7.
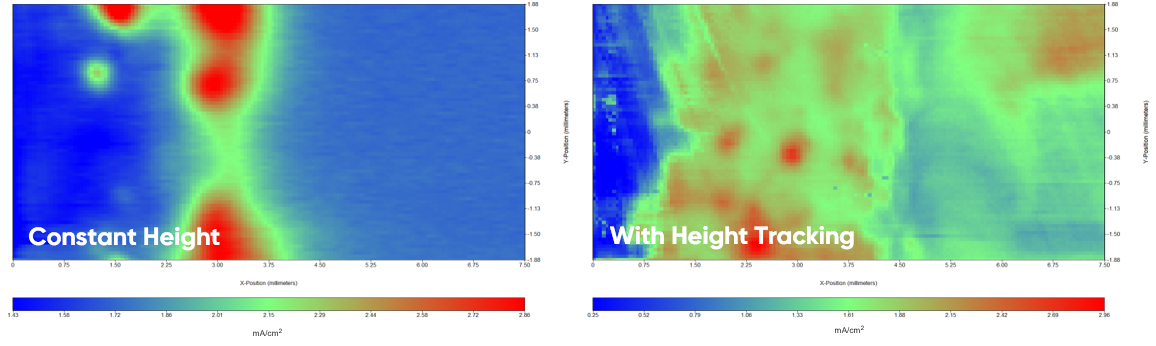
Figure 7 : The effect of using height tracking on an area scan of a sample with background topography is illustrated using a SVET measurement without (constant height) and with height tracking (constant distance).
For SECM experiments Intermittent Contact (ic)-SECM can be used to follow sample topography at the same time as the SECM experiment is performed.
Scan type
For dc-based measurement types, i.e. dc-SECM, dc-SDC, SKP, and SVET, users can perform measurements in step scan or sweep scan mode. In step scan mode the probe pauses at each point to collect data which results in a higher quality measurement. In sweep scan mode, however, the probe measures continuously throughout each line, which although it results in a reduction in measurement quality, offers shorter experiment times, which can be essential when studying dynamic samples. Fig. 8 shows a comparison between step and sweep scan SECM experiments.
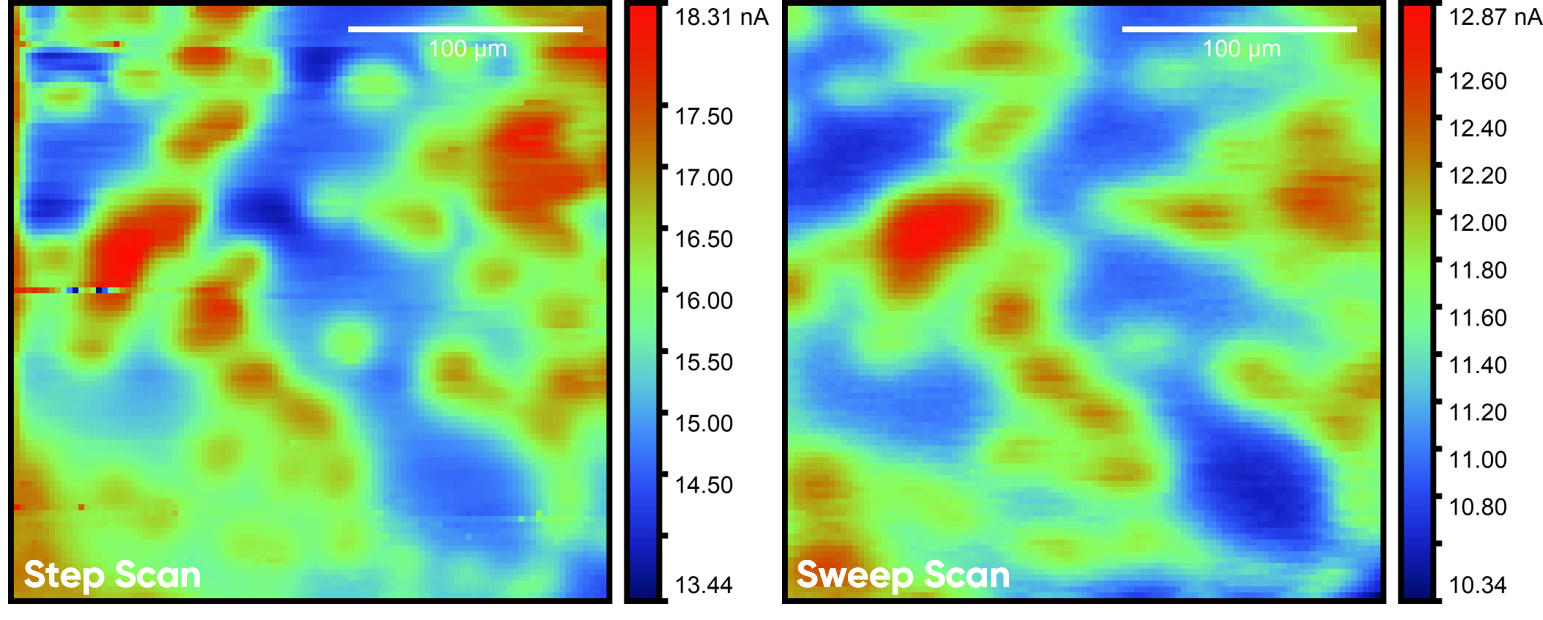
Figure 8: The effect of step scan and sweep scan on the resulting area scan are compared with SECM.
Scan rate
Scan rate is important to consider when performing a scanning probe electrochemistry experiment. The scan rate is selected to maintain the measurement accuracy, avoid solution stirring (where applicable), avoid excess noise and/or distortion of the signal, and reduce the experiment time. This is particularly true when sweep scan is used, because the continuous movement of the probe means that unlike in step scan there is no possibility of delaying the measurement, or averaging the data, at each point to reduce the impacts of all of the effects just outlined. Using a slower scan rate will result in a sharper image, as illustrated for SVET in Fig. 9, however, the experiment time will be longer which can be undesirable for dynamic samples. It is important to note that with changing scan rate users may need to alter technique specific settings for the best possible image.
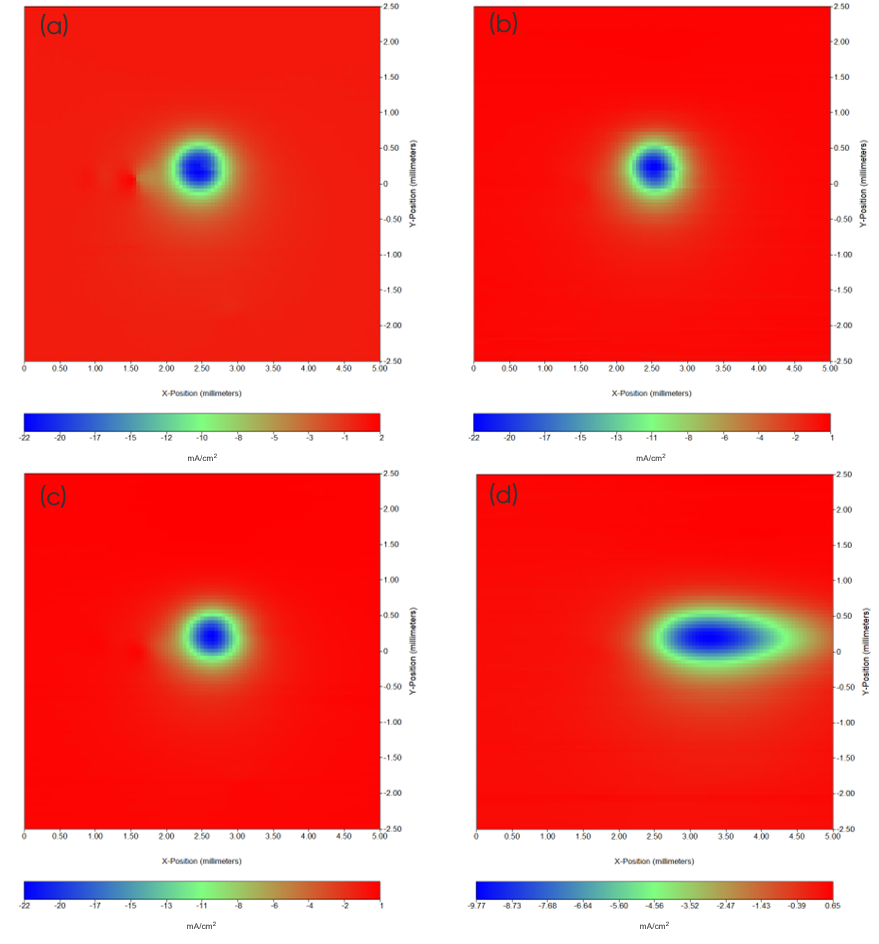
Figure 9: The effect of increasing scan rate on an area scan is illustrated with SVET measurements performed at 100 µm/s (a), 500 µm/s (b), 1000 µm/s (c), and 5000 µm/s (d).
Step size
Finally, in all scanning probe electrochemistry experiments the step size must be carefully considered. As we have already seen, the resolution, and as a result the sharpness of the measurement is ultimately dependent on the probe size, however, the step size also affects the measurement clarity. For the clearest images oversampling, where the step size is smaller than the probe size, is often used. However, it is important to consider that if the step size is reduced, but the scan area remains unchanged, the experiment time will increase due to the increased number of pixels required, therefore to counter this you may also need to reduce the scan area. The effect of step size on the resulting measurement is illustrated for SKP in Fig. 10.
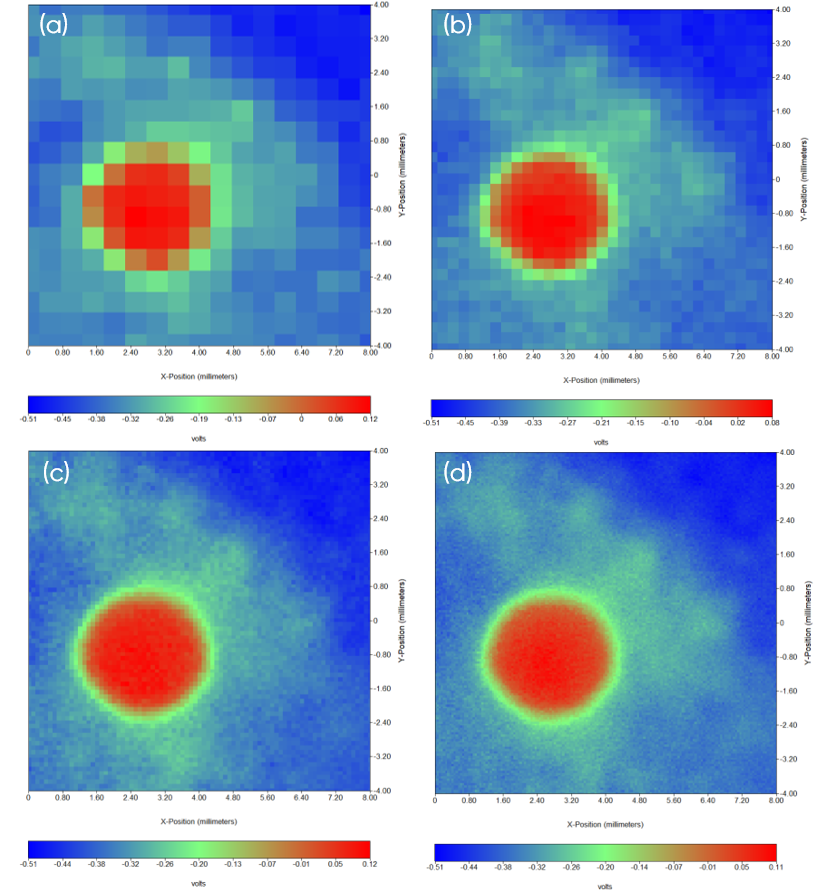
Figure 10: The effect of changing step size on the area scan is illustrated with SKP measurements performed with a 500 µm (a), 250 µm (b), 100 µm (c), and 50 µm (d), step size.
Conclusion
A number of considerations for obtaining high quality area scans, universal to the scanning probe electrochemistry family, have been outlined. Although each technique type will have their own settings and considerations which must be made for the best images, the factors outlined here are a good starting point for experiments of all types.


