

Sweep scan with Height Tracking Scanning Probes – Application Note 26
Latest updated: June 13, 2024Introduction
For dc-based scanning probe techniques on the M470, including Scanning Kelvin Probe (SKP), Scanning Electrochemical Microscopy (SECM), and Scanning Vibrating Electrode Technique (SVET), users have the option of two different scan modes: Step Scan and Sweep Scan. In Step Scan mode the probe pauses at each point in the area scan to make a measurement, before moving to the next point in the line. In Sweep Scan mode, however, the probe moves throughout the line collecting data at given time intervals. Because the scan velocity is well defined the time-based data can be converted by the system to distance dependent data. The two modes are compared in Fig. 1.
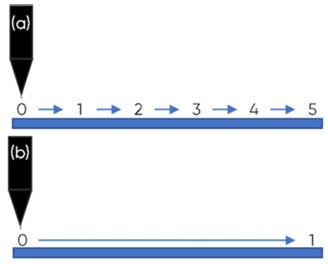
Figure 1: Step scan (a), and sweep scan (b) are illustrated.
Traditionally sweep scan experiments have been confined to constant height experiments only. This means they could only be used for relatively flat samples. When a sample with background topography, including sample tilt, is of interest constant distance measurements, where the probe to sample distance is constant, are required to ensure the topography effect does not dominate the signal measured. For all experiment types, other than ic-SECM, this is achieved through the use of a Height Tracking (HT) measurement. In these experiments a pre-measured topography map is used to allow the probe to follow the sample topography. Because this requires the probe z position to be updated at every point this has traditionally required the use of a step scan measurement. Although step scan measurements can provide higher quality data, than sweep scan measurements, this is achieved with a noticeable time cost. For example, in the SKP experiments in SCAN-Lab AN #24 [1], an SKP area scan performed in step scan mode took almost seven times longer than the same measurement in sweep scan mode.
Although using step scan with HT it is possible to follow sample topography during a measurement, the increase in experiment duration required for this can make such a measurement practically impossible. This is particularly the case for corrosion measurements where the sample can noticeably change over extended experiment periods. The introduction of the sweep scan with HT option on the M470, therefore, opens up measurements on sample types which previously would not have been possible. Furthermore, the introduction of the sweep scan with HT option improves the workflow of users, allowing samples to be measured in a few hours or less, rather than overnight.
The sweep scan with HT option is available for M470s with MSD02 V1.08 with firmware V3.01 Rev. 167. For M470s with earlier MSD02, sweep scan with HT can be added through upgrade of the Z axis, please contact your local BioLogic representative for more information.
This note introduces the sweep scan with height tracking option for the M470, with examples from dc-SECM, SKP, and SVET.
Topography Input
1. Guidelines for file selection.
Sweep scan with HT is available for all dcbased techniques, including dc-SECM, SKP, and SVET. To use the sweep scan with HT option an M470 topography input file must be available. The options for topography input files are shown in Tbl. 1. Note any topography file can be used in any HT experiment. For dc-SECM, and SKP another module is not required, however for SVET a module capable of measuring topography is required, this would typically be the OSP470, used for the Optical Surface Profiler (OSP) technique.
Table 1: The topography input files available, and module used to measure each, are listed.
When selecting a topography map for use as the input file, the selected map must:
- Be complete and fully populated.
- Contain the same number of data
- points as the planned HT area scan.
- Have the same x (width) and y (height) as the planned HT area scan.
- Have the same step size in x and y as the planned HT area scan.
If these criteria are not met the topography file cannot be used by the software.
Although not a software requirement it is also important that the topography map matches the expectations for the sample. For example, if the sample is relatively flat, but the topography map shows a sample with large topography changes then it is likely the map needs to be remeasured. It is the user’s responsibility to confirm the quality of the topography input.
2. Aligning OSP for Topography Input
When the OSP470 is used to determine the sample topography it is necessary to align the OSP laser and the probe. Misalignment of the OSP laser and the probe can lead to artefacts in the measurement, and/or probe crash. To further avoid probe crash OSP measurements are performed without the probe in place. Finally, the OSP measurement is performed in air to avoid any reaction at the sample.
In the measurements performed here a mark was made on the sample, to which the OSP laser is aligned. The OSP laser is then moved a known distance in x and y, and the axes zeroed before beginning the OSP measurement. Once the OSP measurement is complete the measurement probe is mounted, and aligned to the original mark used to align the OSP laser.
The probe is moved the same x and y distance from the mark as for the OSP alignment. The probe is then moved to the correct z position, the axes zeroed, and the solution, if used, added.
Methods
Measurements were performed using the M470, with software V1.50. If a potentiostat was required the SP-300 was used.
Topography was measured in one of two ways. For the dc-SECM the topography input was generated with the Approach Curve Topography Extrapolation Experiment (referred to throughout as Topography Extrapolation), described in more detail in SCAN-Lab TN #22 [2]. Briefly the Topography extrapolation generates a map of the sample tilt using three approach curves to the sample. For the SKP and SVET measurements the topography was measured using the OSP470.
3D projections of topography inputs were created using 3D IsoPlot. Post processing of all other area maps was performed using the Gwyddion software [3].
Results
1. dc-SECM
Sweep scan with HT for dc-SECM was demonstrated by measurement of a steel weld cross section in 5 x 10⁻³ mol L-1 K4[Fe(CN)6] / 5 x 10⁻³ mol L-1 K3[Fe(CN)6] / 0.1 mol L-1 KCl. Measurement was performed over a 5000 x 500 μm2 area, using a 15 μm Pt probe biased at 0.65 V against the Ag/AgCl reference electrode. The counter electrode was a Pt sheet. To follow the sample tilt a Topography Extrapolation file was created with an x range of 5000 μm, y range of 500 μm, 501 x points, and 51 y points. The final sample tilt map is shown in Fig. 2.
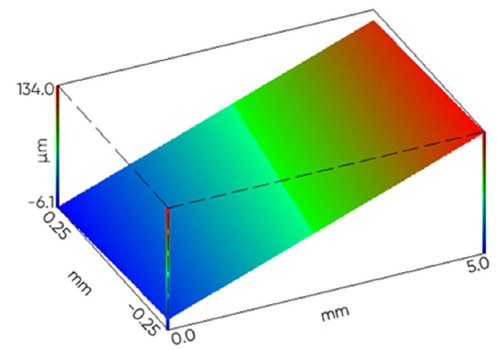
Figure 2: The Topography Extrapolation map determined for the steel weld, and used as the topography input for the dc-SECM HT measurement.
The dc-SECM area scan was performed with HT, using the Topography Extrapolation file, in both sweep and step scan modes. Both measurements were performed over a 5000 x 500 μm2 area, with a step size of 10 μm in x and y. In both sweep and step scan modes a scan velocity of 100 μm/s was used.
The resulting dc-SECM maps are shown in Fig. 3. In order to ensure the same area of the steel weld was measured for both the sweep and step scan measurements the sample was not polished, or otherwise modified, between measurements. The duration of the sweep and step scan experiments are shown in Tbl. 2, which shows the step scan took over 18 times longer than the sweep scan. It can be seen that in the step scan the overall current signal visibly increased from the start to the end of the area scan. Although not shown, this phenomenon was also apparent in subsequent dc-SECM HT scan performed in step scan mode. This is likely a result of the freely corroding nature of the sample which causes an increase in the background concentration of the mediator. The sweep scan experiment does not show a similar increase in background current signal. This sample demonstrates that the drastically reduced experiment time allows for measurement of dynamic samples, which could be otherwise difficult to study by dc-SECM.
Table 2: Durations of dc-SECM height tracking example experiments.
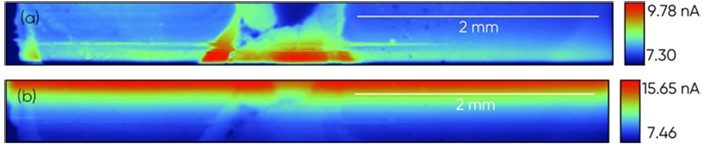
Figure 3: dc-SECM with HT measurements, performed in sweep (a) and step (b) scan mode, of a steel weld in 5 x 10⁻³ mol L-1 K4[Fe(CN)6] / 5 x 10⁻³ mol L-1 K3[Fe(CN)6] / 0.1 mol L-1 KCl, using a 15 µm Pt probe biased at 0.65 V.
2. SKP
To demonstrate the use of the sweep scan with HT option with the SKP technique the inside of a used food can was measured. The topography was first measured over a 30 x 30 mm2 area using OSP in sweep scan mode, with a step size of 500 μm in x and y, and velocity of 5000 μm/s was used. The resulting 61 x 61 pixel OSP measurement was interpolated to a 121 x 121 pixel measurement, over the same x,y area, to allow for a higher resolution SKP measurement. The final OSP map is shown in Fig. 4.
Using the OSP map from Fig. 4, SKP with HT measurements were performed, in both sweep and step scan mode. These measurements were performed over a 30 x 30 mm2 area, with a step size of 250 μm in x and y. A velocity of 500 μm/s was used in both the sweep and step scan experiments. Both measurements used a 500 μm SKP probe.
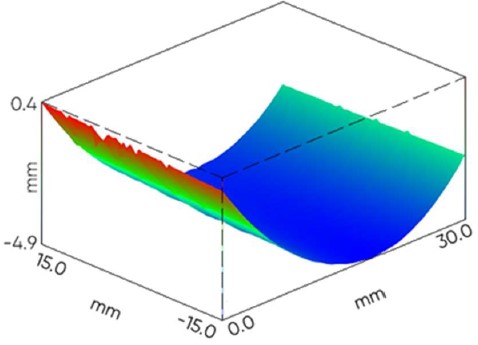
Figure 4: OSP map of the inside of a food can used as the input for SKP with HT measurements.
Fig. 5 shows the resulting SKP maps. While the quality of the step scan experiment is slightly higher than that of the sweep scan experiment, this measurement took over 6.5 times longer than the sweep scan measurement, as shown by the comparison in Tbl. 3.

Figure 5: SKP with HT measurements, in sweep (a) and step (b) scan mode, of a used food can.
Table 3: Durations of SKP height tracking example experiments.
3. SVET
The applicability of the sweep scan with HT mode is demonstrated for SVET by measurement of a steel weld, at Open Circuit Potential (OCP), in 5 x 10⁻³ mol L-1 NaCl. The topography of the weld was measured by OSP over a 7.5 x 3.75 mm2 area. A 50 μm step was used in both x and y. The OSP measurement was performed in sweep scan mode with a velocity of 5000 μm/s. Fig. 6 shows the OSP map.
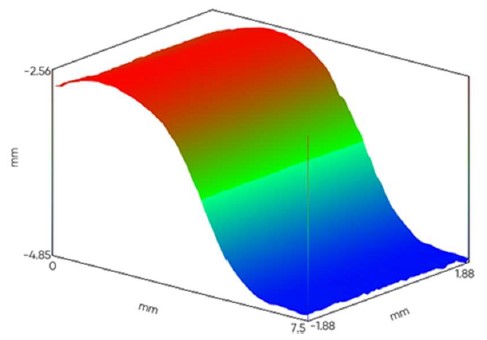
Figure 6: OSP map of the inside of a steel weld used as the input for SVET with HT measurements.
The OSP map in Fig. 6, was used as the topography input for SVET with HT. Two SVET measurements were performed, the first in sweep scan mode, the second in step scan mode. Note that in order to ensure the same location is measured in both sweep and step modes, the sample was not polished, or otherwise modified, between measurements. Both measurements were performed over a 7.5 x 3.75 mm2 area, with a step size of 50 μm in both x and y. Both experiments use a 2000 μm/s velocity.
The resulting maps are shown in Fig. 7. The durations of the two scan types are shown in Tbl. 4. It can be seen that the step scan experiment is roughly 17 times longer than the sweep scan experiment.
Because the steel weld was freely corroding throughout the two measurements there are noticeable differences in the signal measured, though the signal quality is not obviously different. Because SVET is often used in corrosion studies this is an important point. While faster experiments are obviously beneficial for workflow, in the case of SVET HT measurements with sweep scan ensure the corrosion process can be properly followed.
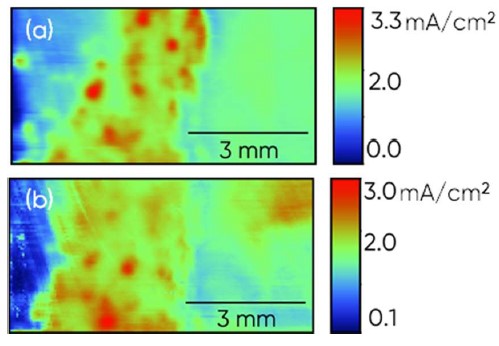
Figure 7: SVET with HT measurements, in sweep (a) and step (b) scan mode, of a steel weld measured at OCP, in 5 x 10⁻³ mol L-1 NaCl.
Table 4: Durations of SVET height tracking example experiments.
Limitations
Although the sweep scan option offers users noticeably faster experiments than would otherwise be achieved if using step scan mode, the experiment cannot be made infinitely fast. In SECM for example if the scan rate is too fast solution stirring can occur. This can alter the measurement as the electrochemical reaction as it is no longer only diffusion controlled. It is therefore up to the user to determine the appropriate compromise between resolution and scanning speed when using a sweep scan experiment.
Conclusion
This note has introduced the height tracking with sweep scan option now available on the M470. The HT with sweep scan option has been shown to drastically reduce the experiment time required for HT dc- SECM, SKP, and SVET measurements.
The HT with sweep scan option can be performed with minimal effect on signal quality, when an appropriate scan rate is selected. This has obvious benefits for experiment workflow, and benefits measurements of processes which would otherwise be too fast to study using HT, such as those involved in corrosion.
References
1. SCAN-Lab Application Note #24 “The use of sweep scan in Scanning Kelvin Probe (SKP) experiments”
2. SCAN-Lab Technical Note #22 “Introducing the Scanning Electrochemical Microscopy (SECM) Approach Curve Topography Extrapolation Experiment”
3. Gwyddion data analysis software : http://gwyddion.net/
Revised in 06/2023


