

Collecting High-Quality EIS Data for AI Training
Latest updated: July 11, 2025Artificial Intelligence (AI) is becoming a key tool in electrochemical data analysis, enabling researchers to process complex datasets more effectively and make more accurate predictions—particularly in battery research. For direct current (DC) techniques, one proven method to ensure high-quality data for lifetime prediction is High Precision Coulometry (HPC). Meanwhile, Electrochemical Impedance Spectroscopy (EIS) is a powerful technique for characterizing electrochemical systems, but its effectiveness—especially when training AI models—depends on the quality of the collected data. Poor-quality EIS measurements can lead to incorrect model predictions, while well-controlled experiments enable AI to extract meaningful insights. This article explores best practices for obtaining high-quality EIS data suitable for AI-driven analysis.
The Four Key Criteria for a Valid EIS Measurement
To ensure that EIS data is reliable and meaningful, the following fundamental conditions must be met:
- Linearity – The system should behave in a linear manner, meaning the response should be proportional to the applied perturbation. If the system is nonlinear, impedance values can become amplitude-dependent, making data interpretation unreliable.

- Time Invariance – The system should not change over the course of the measurement. If properties such as electrode reactions or material degradation evolve during the experiment, the impedance data will not accurately reflect the system’s behavior at a given state.
- Steady-State Condition – The system should have reached equilibrium before measurements begin. Transient effects, such as diffusion stabilization or electrode conditioning, should be accounted for to avoid capturing time-dependent phenomena that could distort results.
- Minimal Noise – External noise sources, such as electromagnetic interference, temperature fluctuations, or unstable connections, must be minimized to ensure clean and repeatable measurements.
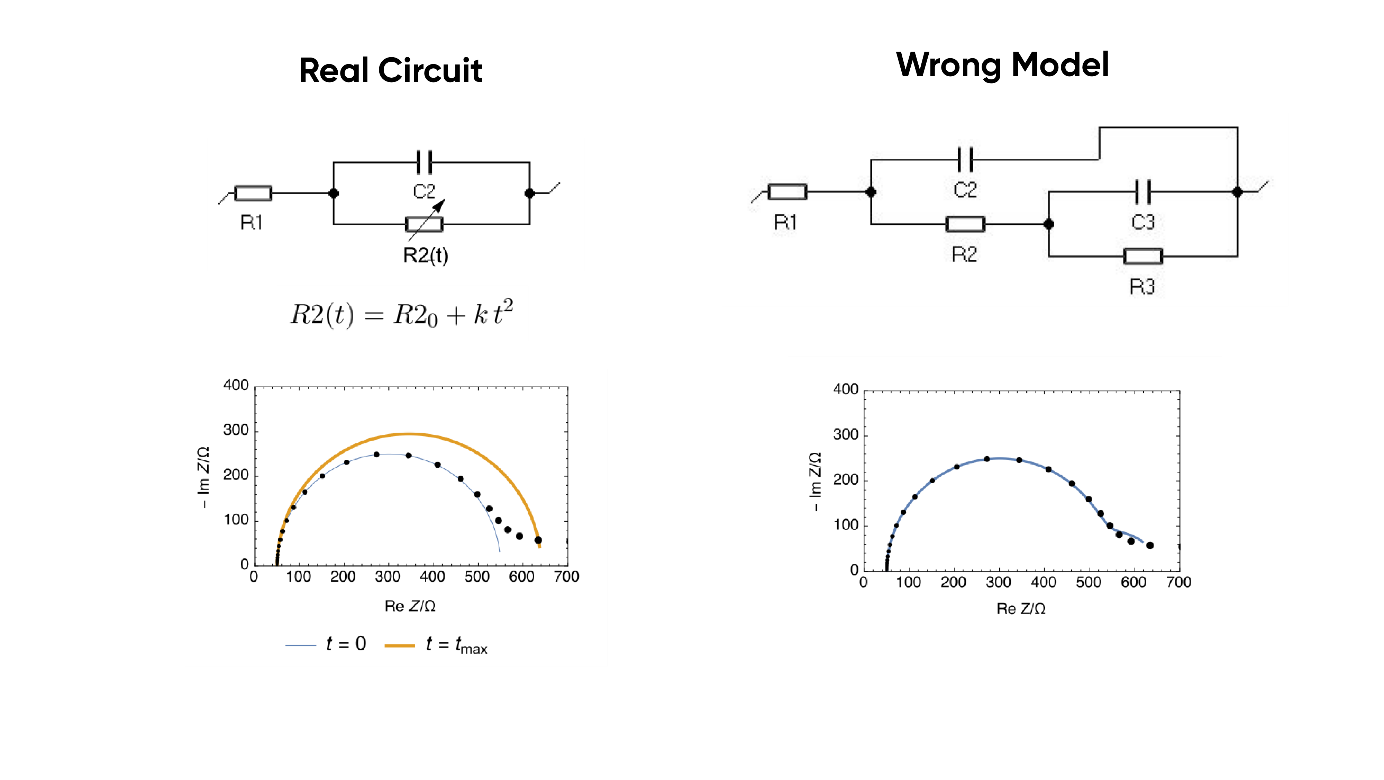
EIS data obtained from time-variant systems can lead to incorrect conclusions when fitted to equivalent circuit models. For example, impedance measurements on evolving systems, such as batteries undergoing degradation, may not accurately represent steady-state conditions. Application Note #55 highlights cases where time-variance results in misinterpretations, emphasizing the need for strict experimental control.

Figure 1: Example of a theoretical time variant system. One element of the real circuit, here the resistor R2, changes its value with the square of time. The simulated impedance, represented by black dots, drifts into low frequencies. Without knowledge of potential problems with the stability of the system one may try to fit with a bad model.


EIS Quality Indicators
Beyond individual verification methods, certain indicators signal whether an EIS dataset is suitable for AI training:
- Good Phase Angle Resolution – Sharp transitions or inconsistencies may suggest signal distortion.
- Stable Nyquist and Bode Plots – Smooth, well-structured impedance curves indicate well-controlled experimental conditions.
- Reproducibility – Running multiple measurements under identical conditions should yield nearly identical results.

EC-Lab® has built in quality indicators – EIS QI™ – for Total Harmonic Distortion (THD), Non-Stationary Distortion (NSD), and Noise to Signal Ratio (NSR) to help assess the quality of EIS data.
Verifying Measurement Accuracy
Even when the basic criteria for valid EIS measurements are met, further validation is needed to ensure the accuracy of the collected data. Several approaches can be used:
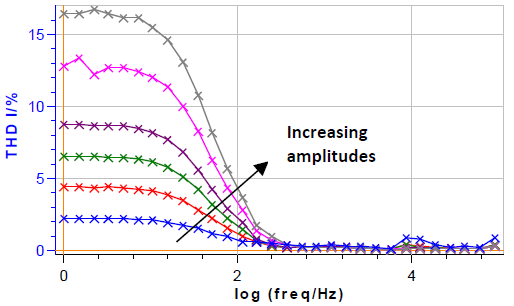
- EIS at Various Amplitudes
- Lissajous Plots
- Kramers-Kronig Transformations
- Model-Based Methods
| Pros | Cons | |
|---|---|---|
| EIS at various amplitudes | Easy to implement and understand | Time-consuming |
| THD | Quantitative information; 1 data point/frequency | Requires theoretical understanding |
| Lissajous | Visual and easy to apprehend | Only gives qualitative information; requires many data at each frequency |
| Kramers-Kronig | Test the general validity of the data (not only linearity) | Only useful if it fails; cannot be used when Nyquist data are incomplete |
| Meas. Model | Easy to implement | Only useful if it fails |
Selecting the Right Equivalent Circuit for Analysis
Once high-quality EIS data is obtained, selecting the appropriate equivalent circuit is crucial for meaningful interpretation. Some key considerations include:
- Parallel vs. Series Components – Certain electrochemical phenomena are best represented by specific circuit configurations and some circuit configurations may be indistinguishable from another, so it’s important to know which one to choose.
- Literature-Guided Selection – Equivalent circuit elements should align with well-established electrochemical theory and previously reported models.
- Expert Knowledge and Visual Verification – Experienced researchers can identify artifacts and inconsistencies by visually inspecting impedance spectra before fitting models.
- Sensitivity Factors – EC-Lab® includes sensitivity factors that assign a numerical value to equivalent circuits in a model to help determine whether the circuit is considered unnecessary.
Conclusion
High-quality EIS data is essential for both traditional electrochemical analysis and AI-driven modeling. By ensuring adherence to the four fundamental criteria, verifying accuracy through multiple methods, and selecting appropriate equivalent circuits, researchers can generate robust datasets that enable reliable AI training. Investing in precise experimental procedures is the key to unlocking AI’s full potential in EIS analysis.


