

Multi Pitting Corrosion (Pitting) Corrosion – Application Note 25
Latest updated: January 31, 2024Abstract
Pitting is one of the most insidious forms of localized corrosion. This kind of corrosion occurs on passivable materials in media containing halide species. The resistance to pitting corrosion is evaluated using pitting potential determinations. A statistical variation of this parameter is usually observed which is this why a multichannel potentiostat is recommended for testing numerous sample at the same time and in same experimental conditions.
In this note, the pitting corrosion of four steel samples was studied using Linear Polarization (LP) and Multi-Electrode Potentiodynamic (MPP) techniques. A VMP3 with CE to the Ground mode and N’Stat box cable were used for simultaneous measurement on the four samples. The statistical evaluation of the pitting potential was determined using the Multi Pitting Statistics tool.
Introduction
The impact of corrosion on our daily lives is well documented, with the cost estimated to be as much as 3-4% of industrialized nations’ gross domestic product. Most metals are sensitive to corrosion in the presence of oxygen and humidity. The general equation of this oxidative process is described as follows:
$$M \rightarrow M^{z+} + ze^- \tag{1}$$
Corrosion is a general term which generalizes various kinds of processes, such as:
- uniform corrosion: corrosive attack on the entire surface area,
- crevice corrosion: localized corrosive attack caused by oxygen,
- galvanic corrosion: corrosion caused by two different materials in contact,
- pitting corrosion: localized corrosive attack caused by aggressive anion.
In this note, only the pitting corrosion in presence of chloride is investigated. For this purpose, Linear Polarization (LP) and Multi-electrode Potentiodynamic Pitting (MPP) are performed.
Experimental Conditions
Investigations are carried out with a VMP3 and EC-Lab® software with 3% NaCl at room temperature in aerated water. Before measurements, the electrodes were polished for 5 minutes using the PK-3 Electrode Polishing kit and rinsed by distilled water and alcohol.
A multi-working electrode set-up is required. In order to overcome the connection complexity due to the multi-electrode investigation, N’Stat Box is used (Figure 1). Note that the N’Stat Box is compatible only with VMP3 technology (including VMP3, SP-50, SP-150, and VSP). The utilization of such a device requires the “CE to ground” connection (Figure 2) which is described in technical note #23 [1]. Electrodes are as follows:
- 4 working electrodes made of steel,
- Ag/AgCl electrode as a reference electrode,
- platinum wire as a counter electrode.

Figure 1: N’Stat Box.

Figure 2: “CE to ground connection” in “Advanced Settings” window.
Results
LP Investigations
LP investigations are performed in the anodic area using a slow scan rate (Figure 3) in order to be under steady-state conditions [2]. Moreover, it is important to note that the E range is reduced from -2 V to 2 V in order to optimize the potential resolution to 100 µV. Measured current is averaged in order to reduce noise.

Figure 3: “Parameters Settings” window for LP measurement.
From LP curves (Figure 4), it is possible to determine the corrosion potential (Ecorr) and other related parameters, such as corrosion current (Icorr), cathodic (βc) and anodic (βc) Tafel constant and corrosion rate with the “Tafel Fit” analysis tool. Moreover, the pitting potential (Ep) can be directly determined by tracking the cursor on the graph and by right clicking on the pitting potential (Figure 5).

Figure 4: Four-electrode LP curves.
An example of data determination is shown in Figure 5. All results are summarized in Table I.
Analysis of Table I shows similar Ecorr for the four electrodes included between -1,152 and 1,000 mV vs. Ag/AgCl with -1,078 mV as mean. Concerning Ep, values are included between -760 and -740 mV vs. Ag/AgCl with an average of -747 mV vs. Ag/AgCl.
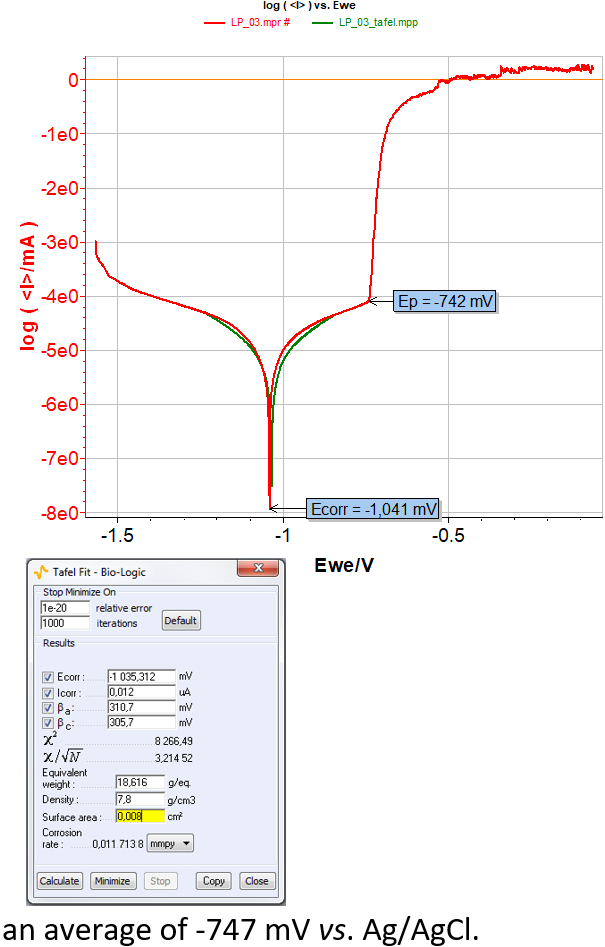
Figure 5: LP curves of the electrode number 3 and its corresponding “Tafel Fit” window.
Table I: Data resulting from LP investigations (Potentials are given in mV vs. Ag/AgCl).
| Electrode | 1 | 3 | 4 | 12 |
|---|---|---|---|---|
| Ecorr/V | -1.152 | -1.035 | -1.124 | -1.000 |
| Icorr/nA | 12 | 12 | 15 | 13 |
| βc/mV | 265 | 306 | 290 | 323 |
| βa/mV | 362 | 311 | 384 | 328 |
| Corrosion rate/mmpy | 13·10-3 | 12·10-3 | 15·10-3 | 13·10-3 |
| Ep/mV | -760 | -742 | -746 | -740 |
MPP Investigations and Statistics
Parameters of MPP investigations are similar to those of LP investigations (Figure 6). According to the results of LP investigations, Ip, which is the limiting current, is set to 50 µA.
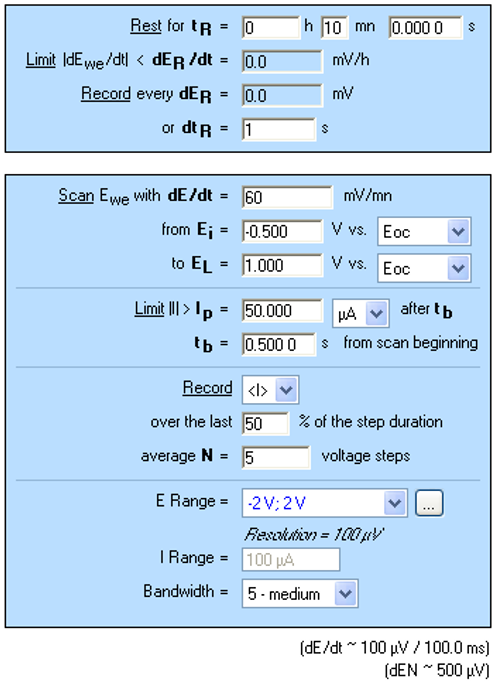
Figure 6: “Parameters Settings” window for MPP measurements.
MPP curves (Figure 7) display the current shift due to the pitting process.
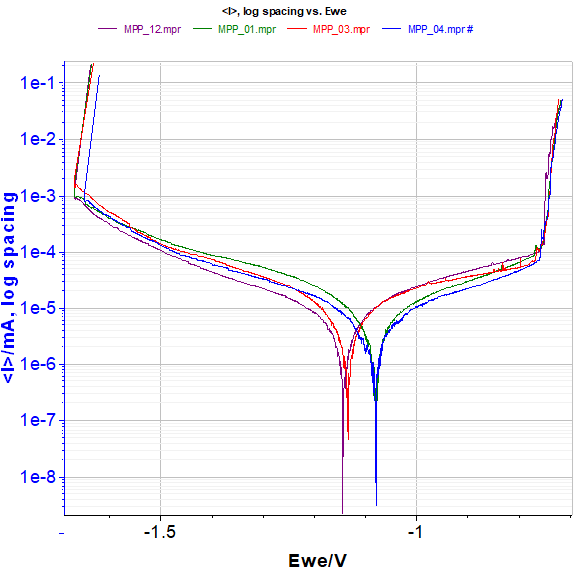
Figure 7: MPP curves of the four electrodes.
Ep and Ecorr are determined simultaneously via the “MultiPitting Statistics” function (Figure 8). Note that Eoc of the “Multi Pitting Statistics” corresponds to Ecorr. Ep and Ecorr computed thank to this statistics tool, are in agreement with those obtained with Tafel Fit from LP results. Indeed, Ecorr averages are -1,078 mV and -1,202 mV vs. Ag/AgCl for LP and MPP investigations respectively, and Ep averages are -747 mV and -716 mV vs. Ag/AgCl for LP and MPP investigations respectively.

Figure 8: “Multi Pitting Statistics” window in “Analysis” menu in EC-Lab® software.
Conclusion
This note demonstrates some corrosion techniques (LP and MPP) and the corresponding analysis processes (“Tafel Fit” and “MultiPitting Statistics”). These tools are complementary. Indeed, “Tafel Fit” allows the user to obtain the corrosion rate and other typical corrosion parameters, whereas “MultiPitting Statistics” allows the user to compute data simultaneously from several data files.
Other investigations can be carried out with EC-Lab® software such as Critical Pitting Temperature with a thermostat controlled via EC-Lab® software.
References
- Technical Notes #23 ”Graphic properties – Part II: Graph Representation definition”
- D. Landolt, Traité des Matériaux, Vol. 12, Presses Polytechniques et Universitaire Romandes, Lausanne (2003).
- J.-P. Diard, B. Le Gorrec, C. Montella, Cinétique électrochimique, Hermann, Paris (1996).
Revised in 04/2023


