

Corrosion current determination with mass transfer limitation Corrosion – Application Note 47
Latest updated: June 5, 2026Abstract
In many electrochemical methods, the estimation of the corrosion rate are based on the assumption that the corrosion system is tafelian whereas the corrosion of the most materials are often mass transfer controlled.
Introduction
Several methods are available in EC-Lab® to measure the corrosion current:
- Stern Method (Tafel Fit),
- Stern and Geary method,
- VASP (VASP Fit),
- CASP (CASP Fit).
The first two methods are described in the Application Note #10 [1], the latter two in the Application Notes #36 [2] and #37 [3]. These methods are used in the case of general corrosion when the steady-state current potential curve satisfies the Stern (or Wagner-Traud) relationship:
$$I = I_\text{corr} \left( \text{exp}\left(\frac{E-E_\text{corr}}{\frac{\beta_ \text a}{\text{ln} \, 10}}\right)-\text{exp} \left(-\frac{E-E_\text{corr}}{\frac{\beta_\text c}{\text{ln} \,10}} \right) \right) \tag{1}$$
In this note, it is shown that the four different methods for determining corrosion parameters can be used in the case of general metal corrosion, limited by the mass transport of the oxidant. A new dummy cell that mimics such a system is used for this purpose.
Corrosion with mass transfer limitation
I vs. E Relationship
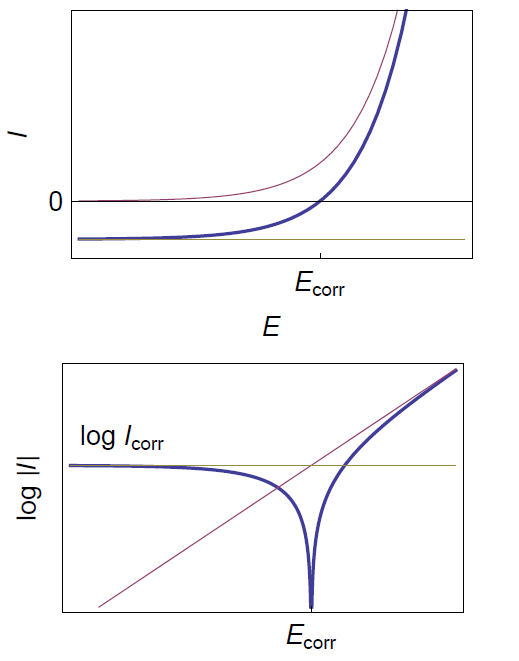
The corrosion rate is limited by mass transfer for instance in the presence of dissolved oxygen or when the cathodic reaction occurs very quickly [4]. The I vs. E relationship in these conditions is obtained with βc tending to infinity in Eq. (1):
$$\beta_\text{c} \rightarrow \infty \Rightarrow I = I_\text{corr} \left( \text{exp}\left(\frac{E-E_\text{corr}}{\frac{\beta_\text a}{\text{ln} \, 10}}\right) -1 \right) \tag{2}$$
The corresponding curve is given in Fig. 1.

Figure 1: Steady-state curves I vs. E and log|I| vs. E for the corrosion of a metal with mass transfer limitation of the oxidant.
Dummy cell
- Mészáros dummy cell
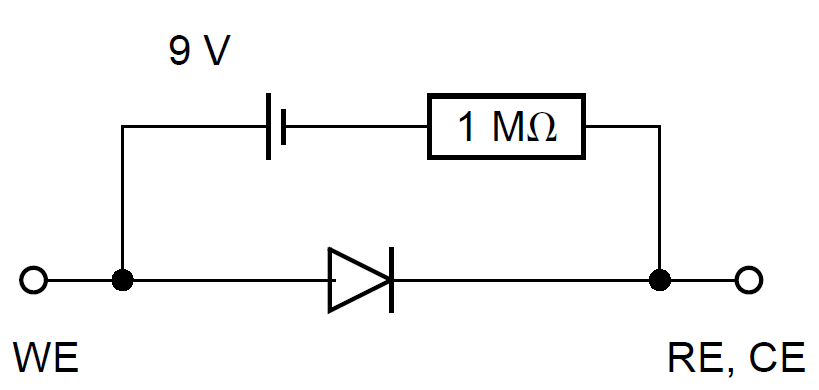
It is convenient to use a dummy cell as model of known current vs. potential characteristics to check the different methods used to measure the corrosion parameters. Meszáros et al. have proposed a dummy cell for a corroding electrode, for which the cathodic partial process is diffusion-controlled [5]. The electrical circuit of this dummy cell is shown in Fig. 2.

Figure 2: Mézáros’ dummy cell [5].
As shown in Fig. 3 the cathodic plateau is not strictly horizontal. A Tafel Fit analysis yields to $\beta_\text c \approx 2×10^4$ mV (Fig. 4) (1).

Figure 3: Steady-state log|I| vs. E curve for the Mészáros dummy cell.
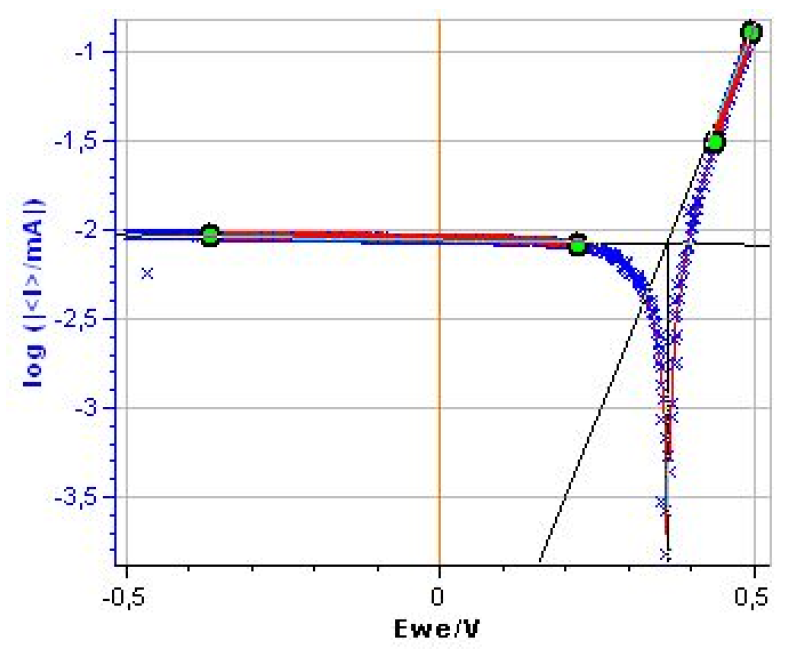

Figure 4: Tafel Fit Analysis of the Mészaros dummy cell. Βc ≈ 2.0×10⁴ mV.

- New dummy cell
A new, slightly more complicated, dummy cell (named BP dummy cell), is shown in Fig. 5. Its I vs. E curve shows a cathodic plateau which is strictly horizontal (Fig. 6).

Figure 5: BP dummy cell.
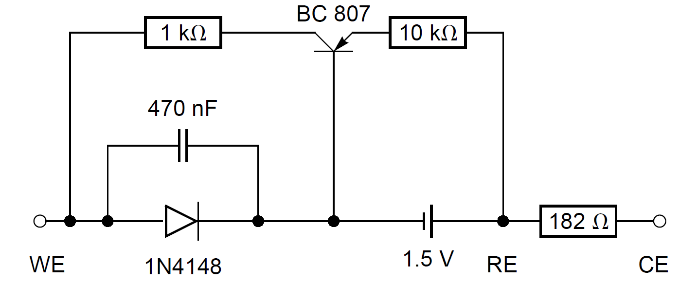

Figure 6: Steady-state log|I| vs. E curve for the BP dummy cell.
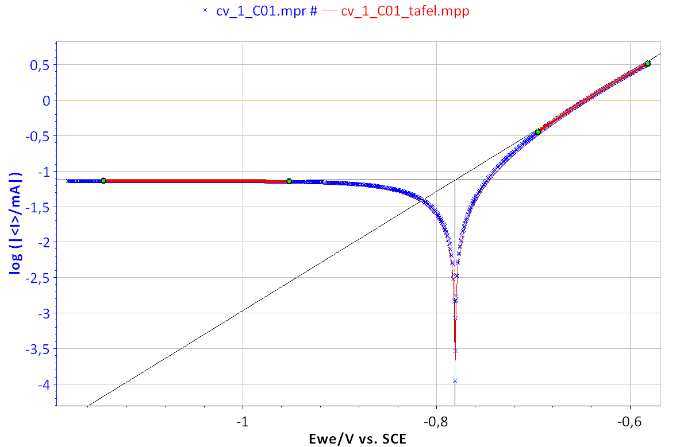
Figure 7: Tafel Fit Analysis of the BP dummy cell. Icorr = 74.731 µA, βa = 119.2 mV, βc ≈ 2.35 × 10¹⁰ mV.

The different methods for determining the corrosion parameters are tested on the BP dummy cell.
Stern method (Tafel fit)
From the graphs displaying log |I| vs. EWE, it is possible to determine the values of Icorr, Ecorr, βa and βc by a simple graphical analysis. The Tafel fit, which is a Graph Analysis tool from EC-Lab® can automatically determine these values (Figs. 6 and 7). The value of Icorr, Ecorr, βa and βc parameters are given in the caption of Fig. 7.
Stern and Geary method
The expression of the polarization resistance Rp can be defined as
$$R_\text p = \frac{1}{\frac{\text dI}{\text dE}} \tag{3}$$
Using for I the expression of Eq. (1) it gives
$$I_\text{corr} = \frac{\beta_\text a \beta_\text c}{R_{\text{p},E_\text{corr}} (\beta_\text a + \beta_\text c) \text{ln} \,10} \tag{4}$$
And for a mass transfer limitation of the oxidant:
$$\beta_\text{c} \rightarrow \infty \Rightarrow I_\text{corr} = \frac{\beta_\text a}{R_{\text{p},E_\text{corr}} \, \text{ln} \,10} \tag{5}$$
The value of Rp can be measured by the micropolarisation method (AN #10 [1]), or, better still, by plotting the impedance diagram of the dummy cell at rest potential (Fig. 8).

Figure 8: Nyquist diagram of the impedance of the BP dummy cell measured at the rest potential (x), δE=10 mV, f ϵ [500 kHz, 200 mHz], and theoretical diagram of a R1/C1 circuit (line) with R1=624.4 Ω, C1=0.455 10-6 F.
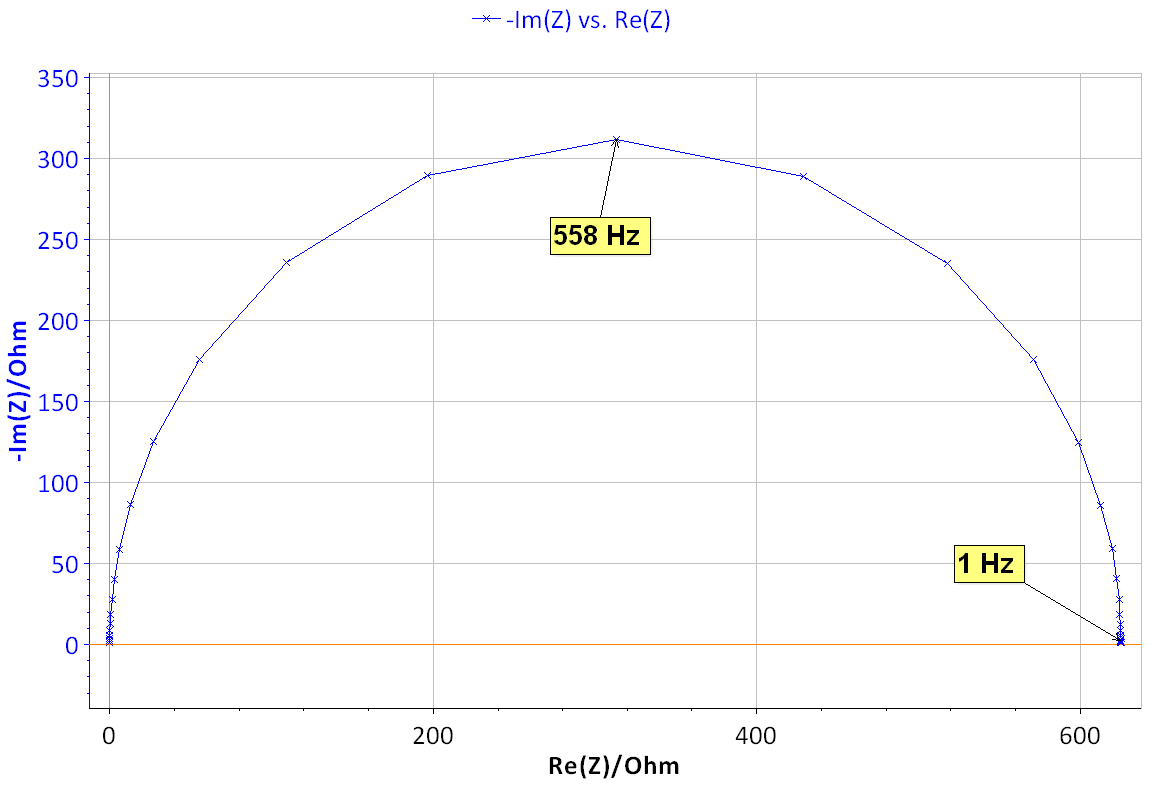
The Nyquist diagram shown in Fig. 8 can be fitted using Z Fit [6]. The value of Icorr can be determined using the _a found previously by Tafel Fit analysis. With Rp = R1 = 624.4 Ω and βa = 0.118 V it is obtained, using Eq. (5), Icorr = 82.1 μA.
VASP Method
The VASP method is described in the Application Note #36 [3]. The VASP technique consists of the determination of the change of the measured polarization resistance Rp with the potential amplitude variation δE. Rp is determined by Electrochemical Impedance Spectroscopy measurements at a fixed and low enough frequency. For a negligible ohmic drop, Rp can be expressed by the following relation
$$\frac{1}{R_{\text p}}=I_\text{corr} \sum^\infty_{k=0} \frac{b_\text a ^{2k+1}+b_\text c ^{2k+1}}{2^{2k} k!(k + 1)!} \delta E^{2k} \tag{6}$$
with ba = ln 10/βa and bc = ln 10/βc. In the case where the corrosion is limited by mass transfer, it gives $\beta_ \text c \rightarrow \infty \Rightarrow b_\text c \rightarrow 0$
$$\frac{1}{R_{\text p}}=I_\text{corr} \sum^\infty_{k=0} \frac{b_\text a ^{2k+1}}{2^{2k} k!(k + 1)!} \delta E^{2k} \tag{7}$$
Figure 9 shows the evolution of Rp with the amplitude of the potential amplitude δE.

Figure 9: VASP and VASP fitting plots for the BP dummy cell. f=1Hz.
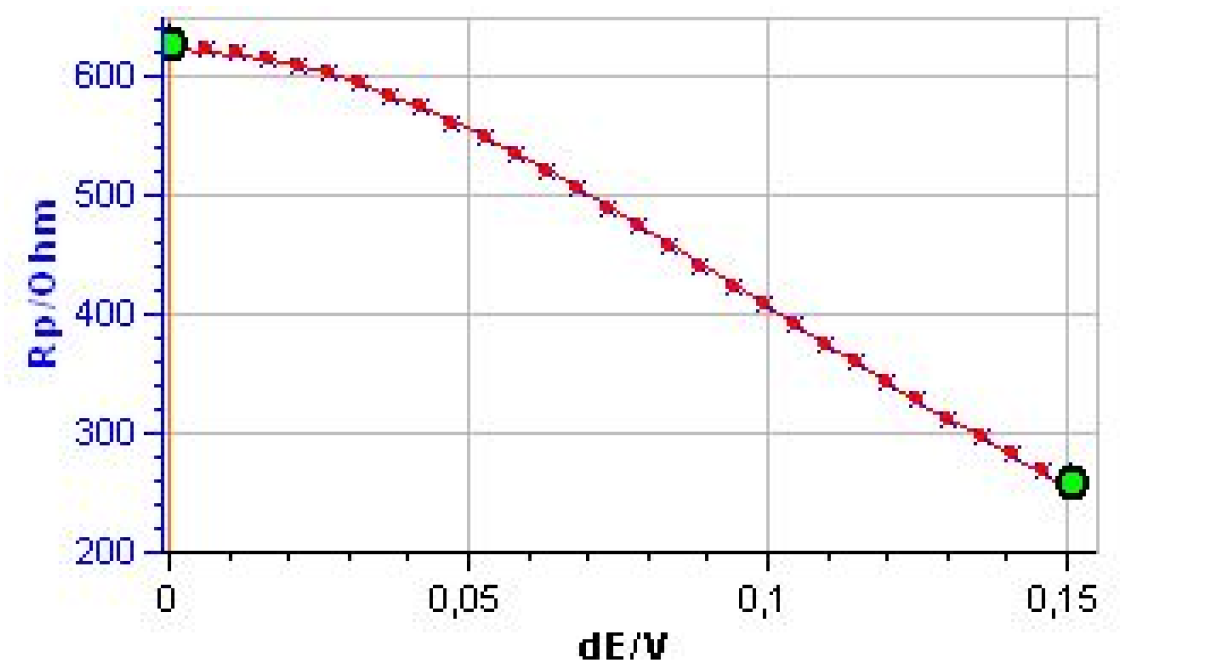

Figure 10: VASP fit window.
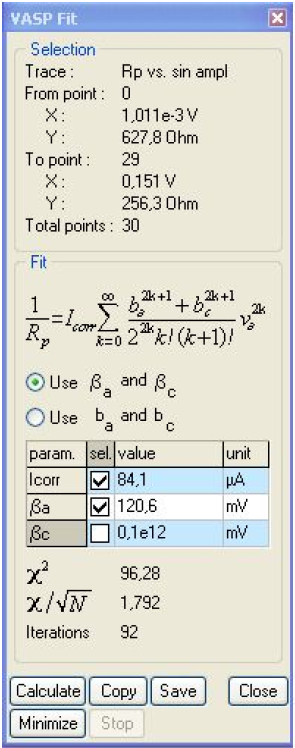
It is clear that Rp decreases with the amplitude, showing the non-linear behavior of the system. It is also clear that at the lowest amplitudes Rp tends to be constant. Fig. 10 shows the results obtained after the parametric fitting of the curve shown in Fig. 9. Note that the βc box is unchecked. The βc value is set to 1011 mV, as determined by Tafel Fit. The corrosion current is now 84.1 μA.
CASP Method
CASP is a new method for the determination of corrosion parameters [4]. The CASP method analyzes the non-linear response of an electrochemical system subjected to a sinusoidal potential of constant amplitude and frequency:
$$\Delta E(t) = E(t) – E_\text{corr} = \delta E \, \text{sin}(2 \pi ft) \tag{8}$$
The amplitude spectrum of the current versus time trace is shown in Fig. 11 for δE = 50mV and f = 1 Hz.
Figure 11: Amplitude spectrum of the current response for the BP dummy cell. δE = 50 mV, f = 1Hz.
The relationships given in [3] are valid only when bc ≠ 0. The values of Icorr, ba and bc given in the CASP Window (Fig. 12) are wrong because in reality, bc = 0. In this case, several relationships between Icorr, ba and harmonic amplitudes are given in [7], including those below:
$$I_\text{corr} = \frac{\delta I_1 \left( \delta I_1 + \sqrt{\delta^2_1 – 8 \delta I^2_2} \right)-4 \delta I^2_2}{8|\delta I_2|} \tag{9}$$
$$b_\text{a} = \frac{1}{\delta E}\frac{\delta I_1 – \sqrt{\delta^2_1 – 8 \delta I^2_2}}{|\delta I_2|} \tag{10}$$

Figure 12: CASP window. δE = 50 mV, f = 1 Hz.
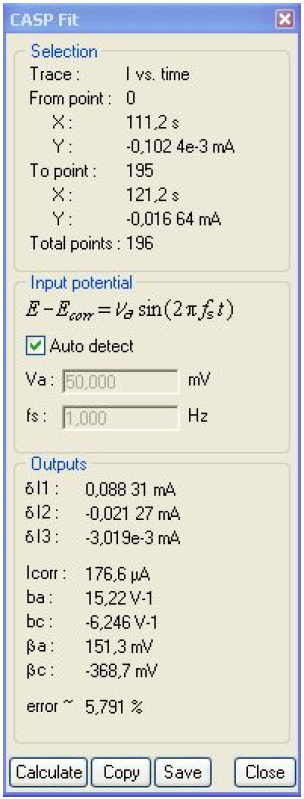
Using Eqs. (9) and (10) and values of δI1, δI2 and δI3 given in Fig. 12, the following values are obtained: Icorr = 68.7 μA, ba = 22.2 V-1.
Conclusion
The values of the corrosion parameters obtained with the BP dummy cell with various different methods are shown in Tab. I. The mean value and the standard deviation of all the parameters are also shown in Tab I. The small values of the standard deviations show that the methods are compatible with one another, in the case where corrosion is limited by mass transfer of oxidant.
This application note showed that it is possible to build a dummy cell equivalent to a system whose cathodic kinetics are limited by the mass transfer of the oxidant. This dummy cell was coined a BP dummy cell. It was also shown using the BP dummy cell, that the methods available in EC-Lab® to determine the corrosion rates (Tafel Fit, Stern Geary, VASP, CASP) can be used to determine the corrosion rate of a system for which the limitation of the mass transfer of the oxidant occurs.
Table I: Summary of the parameter values.
| Method | $I_\text{corr}/\mu A$ | $\beta_\text{a}/mV$ | $b_\text{a}/V^{-1}$ |
|---|---|---|---|
| Tafel Fit | 74.7 | 119.2 | 19.4 |
| Stern Geary | 82.1 | – | – |
| VASP | 84.1 | 120.6 | 19.1 |
| CASP | 120.4 | 22.2 | |
| Mean value | 77.4 | 119.9 | 20.5 |
| Standard deviation | ±7.1 | ±0.81 | ±1.4 |
References
1) Application note #10 “Corrosion current measurement for an iron electrode in an acidic solution”
2) Application note #36 “VASP: an innovative and exclusive technique for corrosion monitoring”
3) Application note #37 “CASP: a new method for the determination of corrosion parameters”
4) I. Epelboin, M. Keddam and H. Takenouti, J. Appl. Electrochem., 2 (1972) 71.
5) L. Mészaros, G. Mészaros and B. Lengyel, J. Electrochem. Soc., 141 (1994) 2068.
Revised in 08/2019


