

UV-Visible spectroscopy & electrochemistry coupling: Spectroelectrochemisty on polypyrrol film Electrochemisty – Application Note 12
Latest updated: November 28, 2023Abstract
In this application note, the set-up of spectro-electrochemical measurements using BioLogic potentiostats/galvanostats is described. It is illustrated on a polypyrrol film which is electro-polymerized on ITO glass. The absorbance measurement is synchronized with the potential sweep of a cyclic voltammogram (CV) using a trigger signal.
Introduction
Electrochemistry alone is no longer deemed sufficient for discrimination and the advantages of coupling techniques are becoming increasingly attractive to researchers.
Instruments for electrochemical studies must be able to connect to other external instruments. Coupling techniques can make electrochemistry a powerful means of characterisation. For example, polypyrrol films have been widely studied in electrochemistry especially the electropolymerisation process [1-3]. Only using electrochemistry is not now sufficient to fully describe the whole electropolymerisation process.
One can easily understand the interest of coupled methods in studying species with spectroscopic properties. Electrochemistry coupled with spectroscopic methods is now a common discriminating technique for polypyrrol study [4-7]. Coupling methods often results in technical set-up problems when synchronizing electrochemical experiments and recording external measurements and variables.
Our instruments are equipped with auxiliary inputs/outputs. They have been designed to interface external instruments with the potentiostat with the possibility to synchronize both experiments. Auxiliary inputs/outputs contain a trigger input and a trigger output either to synchronize an external instrument with the beginning of the potential sweep on the potentiostat or to synchronize the potentiostat with an external instrument. Depending on the instrument that is sending the trigger. Two auxiliary analog inputs are also available and can be used to record auxiliary variables in the electrochemistry data file. An analog output can be used to control the external instrument such as a rotating disk electrode or a temperature control unit.
In our experiment, the potentiostat was synchronized with a UV-visible spectrometer for a spectroelectrochemical study of a polypyrrol film. During a potential sweep, the spectroscopic measurements are performed in the visible wavelength range. The diode array allows for absorbance measurements at the same time for all the visible wavelengths.
A polypyrrol film is electrochemically coated on an ITO glass. The absorbance measurement is synchronized with the potential sweep of a cyclic voltammetry using a trigger signal. The aim of this paper is to show the feasibility of spectroelectrochemical measurements using the BioLogic potentiostat product range.
Experimental Part
Electropolymerization
The polypyrrol film was coated on an ITO glass using cyclic voltammetry (20 cycles). The ITO glass was bulked in an acetonitrile solution (Bu4NPF6 0.2 M) containing 1-methylpyrrol monomer with a concentration of 10-2 M. The potential sweep was used instead of a polymerization in potentiostatic mode in order to obtain a smoothed film. The potential sweep was performed from -0.2 V to 1.015 V/AgCl with a 100 mV/s scan rate. We used a three electrode cell with an ITO glass as a working electrode, a platinum wire as a counter electrode, and a saturated calomel electrode as a reference electrode.
Spectro-Electrochemistry
The spectro-electrochemical measurements were performed in the visible wavelength range (300 to 750 nm) with a homemade spectro-electrochemical cell. The spectrometer used was a diode array with 256 diodes (MOS-DA) allowing 256 simultaneous absorbance measurements. The quartz cell, including three electrodes (working, counter, and reference) and the electrolytic solution (Bu4NPF6 0.1 M), was illuminated with a tungsten white light source (acquisition rate: 1 spectra/2 ms). Before the spectroscopic measurement on the polymer, a spectroscopic blank was made on an ITO glass without a polymer in the same conditions. The ITO glass absorbance will be automatically subtracted from the other spectroscopic data points by the MOS-DA.
During the spectroelectrochemical measurement, the working electrode potential (ITO) is controlled by the potentiostat and swept from -0.2 to 1 V/AgCl (and back to -0.2 V) with a 100 mV/s scan rate.
The description of the spectroelectrochemical assembly can be seen on figure 1. The computer is used to manage the diode array with BioKine software and store and plot data points. It is also used to manage the potentiostat with EC-Lab® software and store electrochemical data points. Both instruments are triggered together with EC-Lab® in order to start the potential sweep and spectroscopic measurement at the same time.
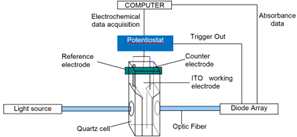
Figure 1: Scheme of the spectroelectrochemical assembly.
Results and Discussion
Figure 2 shows the voltammetric response of the polymer film in an acetonitril solution (Bu4NPF6 0.1 M). The voltammogram of Figure 2 shows the stability of the polymer film coated on the ITO working electrode. Several cycles made in a solution without monomer species are overlaid, showing the stability of the film.
The reversibility of the charge transfer in such a polymer film is often deposition mode-dependent (quasi-reversible in this example).
Figure 3 shows the 3D spectral plot of the film absorbance vs. time. The time variation is equivalent to a potential linear variation from -0.2 V vs. AgCl (t = 1 s) to 1 V vs. AgCl (t = 14 s).
This 3D graph shows the polymer film spectroscopic response during its oxidation (p doping). Some characteristic peaks of polypyrrol can be seen for λ = 350 nm.
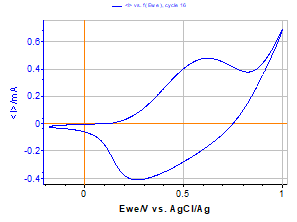
Figure 2: Voltammetric response of the polypyrrole film coated on ITO in a Bu4NPF6 0.1 M solution (v= 100 mV/s).
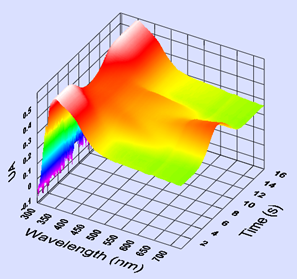
Figure 3: 3D spectroscopic response of the polypyrrol film coated on ITO to a potential sweep from -0.2 V vs. AgCl to 1 V vs. AgCl in a Bu4NPF60.1 M solution.
Conclusion
The results presented above show the feasibility of spectroelectrochemical measurements using our potentiostat product range. Triggered with the diode array, the potential sweep, made by the potentiostat, and the spectroscopic measurement, made by the diode array, start at the same time. With BioKine software, the 3D curve can easily be turned and switched to a 2D curve (either versus time or versus wavelength).
The spectro-electrochemical cell used in this experiment has not been designed specifically for this experiment. It is often difficult to have a standard cell for this kind of experiment that can be used by every customer. Fortunately, we can develop and design particular cells upon customer’s requests.
Using Analog inputs of the potentiostat, the user can store, plot, and analyze data generated by an external instrument.
References
- M. Zhou, J. Heinze, Electrochim. Acta, 44 (1999) 1733.
- M. Zhou, J. Heinze, J. Phys. Chem B, 103 (1999) 8443.
- M. Zhou, J. Heinze, J. Phys. Chem B, 103 (1999) 8451.
- W. Plieth, G.S. Wilson and C. Gutierrez De La Fe, Pure and Appl. Chem., 70 (7) (1998) 1395.
- C. Visy, E. Krivan, G. Peintler, J. Of Electroanal. Chem., 462 (1999) 1.
- K. Crowley, J. Cassidy, J. Of Electroanal. Chem., 547 (2003) 75.
- E. Krivan, G. Peintler, C. Visy, Electrochim. Acta, 50 (2005) 1529.
Revised in 07/2018


