

SECM height relief with OSP: An application in corrosion Scanning Probes – Application Note 2
Latest updated: June 13, 2024Abstract
The response of the Scanning ElectroChemical Microscope (SECM) depends on the surface conductivity of the sample as well as its topography, or more precisely the distance between the probe and the sample. In some cases where the sample is uneven or too rough, the change of response due to the topography is higher the change of response due to conductivity. Measurements in constant distance mode are then needed.
Introduction
The importance of Scanning ElectroChemical Microscopy (SECM) to corrosion applications is of growing interest to both scientific and commercial sectors. SECM’s high resolution capabilities coupled with its quantitative analytical capabilities provide a novel method to interrogate and image a surface’s corrosion resistance. Until lately, this technique’s seemingly ideal application has been hampered by the often large topological features in a sample’s surface, rendering the constant-height area scan (where the probe remains at a fixed vertical position above the sample) useful in only a limited range of samples or limited areas of samples.
The combination of the Optical Surface Profiling (OSP) technique with the SECM allows a user to take a topographical measurement of the surface features and relieve the SECM probe’s position during the scan. Without the Height-Tracking feature, the current measured across a surface can be influenced by the topography and the electrochemical activity, producing a response that is a sum of both. With the addition of Height-Tracking it is possible to effectively remove the effects of topography resulting in an unbiased measure of the electrochemical activity.
Method.
The ability to relieve surface topology requires that an OSP and an SECM area scan can be aligned such that the measured areas are identical, and the probe height is changed in accordance with the surface features. This requires that an alignment is made with reference to a feature that is visible to both techniques.
In the following example, a small section of weld has been extracted from the chassis of a popular off-road vehicle after a number of years of service to examine the possible areas of advanced corrosion in and around the weld area.
As can been seen in Fig. 1 below, the sample A has a flat and level area constructed to the left-hand side of the sample; this could be constructed by grinding or filing from the body of the sample or affixing a purpose-made alignment marker. This area will be used initially to align the OSP and SECM techniques. The area of the sample that is of interest is then masked and a layer of acrylic based paint is applied to the sample body (Sample B). Any corrosion will then be confined to the masked area once the mask is removed. Finally, a fine cross-hair mark is made in the acrylic paint on the flat and level area using a sharp scalpel (Sample C). This fine indent will provide topology that both the SECM probe and OSP sensor can detect.

Figure 1 : Preparation of the sample.
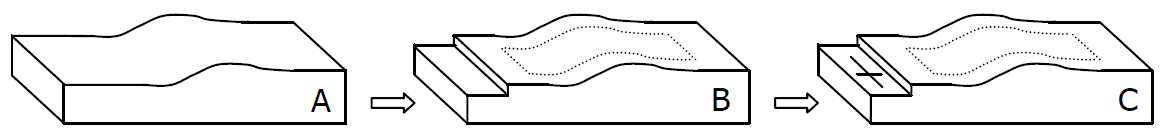

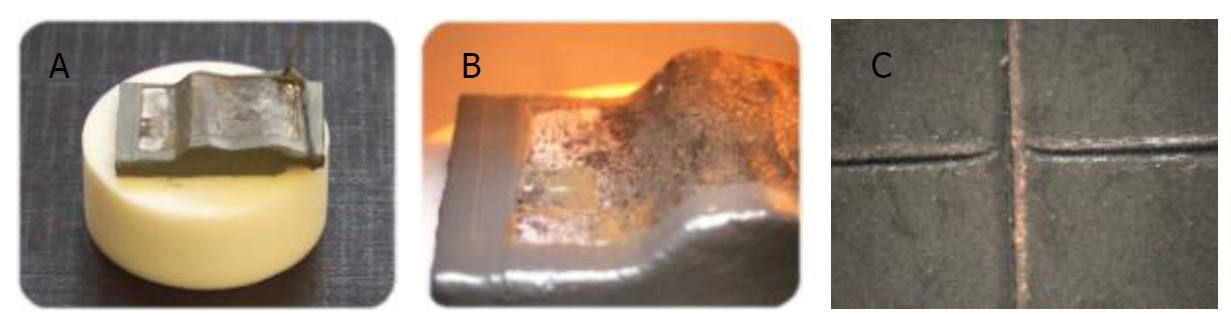
Figure 2 : Samples before (A) and after forced corrosion (B); (C) Alignment cross-hair at a magnification of x200.
Results.
OSP measurement
The OSP sensor head was connected to the M370 and arranged to detect the diffusely scattered laser radiation, and was configured in such a manner that an area scan would bound the cross-hair feature. OSP line scans were then repeated in the X and Y axes and the sample was levelled by thumb screw after each scan. After a number of scans the sample appeared level around the cross-hair feature, sufficient for a standard SECM experiment to take place after the OSP topography experiments had been concluded. An example levelled sample OSP line scan can be seen in Fig. 3. The OSP area scan was then configured to take readings every 10 µm over a 0.25 mm2 area, the results of which can be seen in Fig. 4.

Figure 3 : OSP line scan #5 on the sample C. The Total time to level the sample is approximately 10 min using this method.
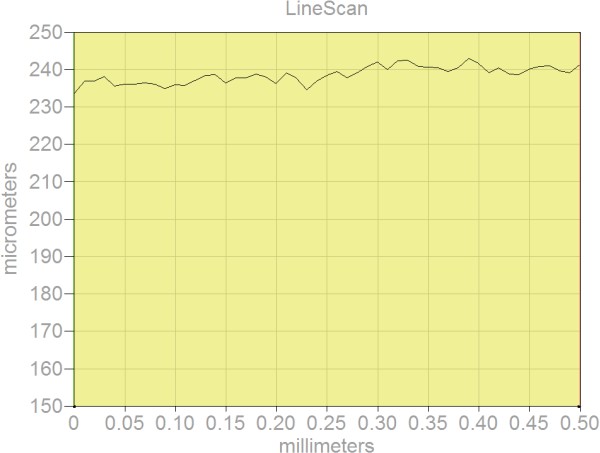

Figure 4 : OSP area-scan of the cross-hair alignment feature, using a step size of 10 µm. The centre of the cross hair is at approximately (220, -40) µm.
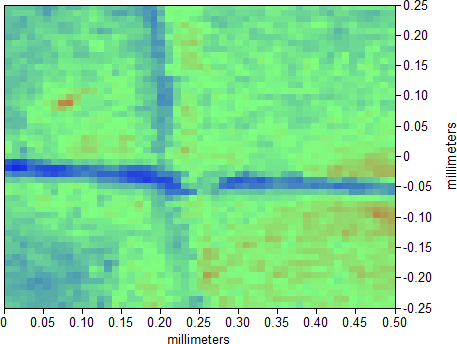
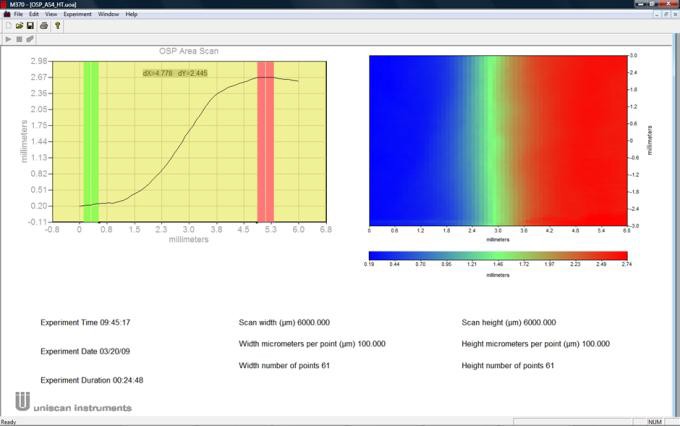
After the centre of the cross-hair is found the OSP probe is moved to that position and its datum is made zero. The probe is then moved from this datum to the area of interest elsewhere on the sample and a record is taken of the movements that are made to travel to this area, in this case (0, 4200) µm. An OSP area scan is again performed, however, this time the topology recorded will be used to relieve the SECM probe in a later experiment. Figure 5 shows the topology around the weld mark.

Figure 5 : OSP area scan of the weld. The highest point is at 2.445 mm.
SECM alignement
The OSP scans now completed, the SECM probe is aligned with the centre of the cross-hair and brought to close proximity to this feature. The 3.5% NaCl solution is added to the electrochemical cell and the Pt Counter and Ag/AgCl Reference Electrodes (CE and RE, respectively) are connected.
For the probe to be brought into close proximity of the surface, a reaction must take place at the tip of the probe. In this case, we chose -0.7 V vs. Ag/AgCl reference electrode. This potential reduces the free oxygen in solution and uses it as a mediator. Using this method, we approach and image the area around the cross-hair. When the probe is in close proximity to the acrylic, the mediator will become used-up and a negative- feedback effect will occur, resulting in a drop in current. As the probe scans over the cross-hair feature, a small well of solution with be available to the tip with more oxygen, resulting in an increase in probe current to bulk solution current levels.
The American convention for the current was chosen, hence oxidation current are negative and reduction current positive.
In the same manner as performed previously with the OSP head, the SECM probe is centred on the cross-hair and its datum is made zero. Next the probe is retracted from the sample and repositioned at (x,y) = (4200, 0) where a new approach curve experiment is performed ready for the next area scan. This next area scan will require the height-tracking data to relieve the weld’s topology. Figure 6 shows the end-result of the SECM area scan over the cross-hair feature.

Figure 6 :SECM area scan of the flat and levelled cross- hair mark. The current increases by approximately 650 pA over the cross.
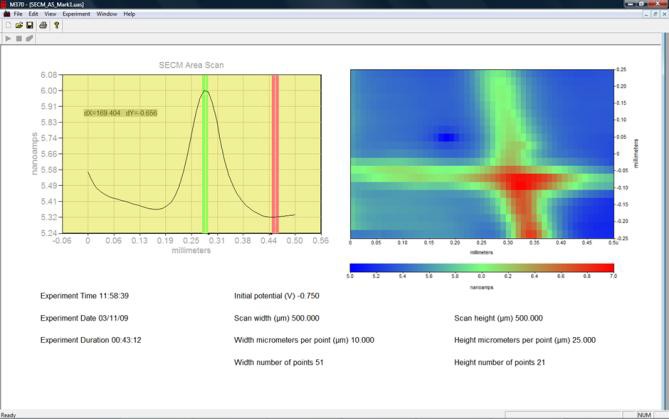
The maps obtained by OSP and SECM (Figs. 4 and 6) should exactly look alike, to make sure the topographical and SECM data correspond to the same locations on the sample.
SECM measurement with topology relief.
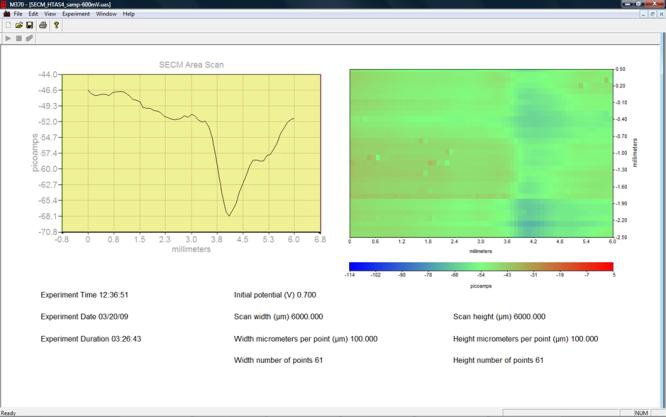
Two different experiments were performed. Firstly, the sample was biased at a voltage that was slightly more anodic than the measured open circuit potential by approximately 100 mV (Figure 7). This was intended to ensure the system did not passivate during the course of the experiment and is intended to help expose those areas that would corrode easily.

Figure 7 : Oxidation of Fe(II) to Fe(III) over a biased sample at a weld mark, as measured by the SECM area scan using height-tracking relief.
Secondly, the sample bias was removed and the sample allowed to corrode naturally (Figure 8).
In both experiments, the probe was held at +0.6 V vs. Ag/AgCl, thus the measurements shown in Figs. 7 and 8 are the oxidation of Fe(II) to Fe(III). The experiment duration is approximately 3.5 h.
Figure 8 : Oxidation of Fe(II) to Fe(III) over an unbiased sample at a weld mark, as measured by the SECM area-scan using height-tracking relief.
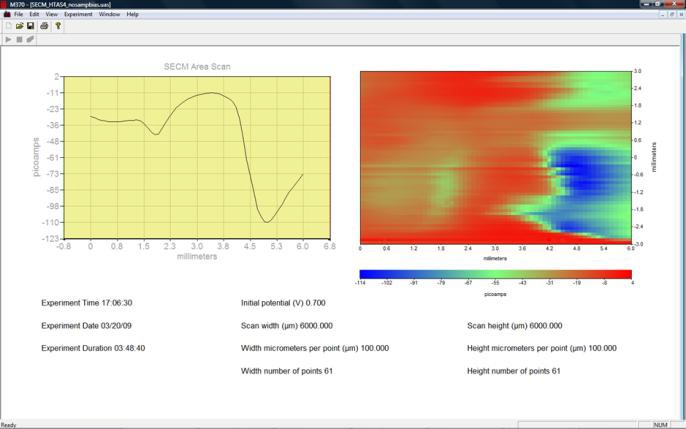
On both Figs. 7 and 8, higher negative currents can be seen in patches along the weld mark, meaning that the sample surface at the weld mark is more conductive than over the rest of the sample.
Conclusion
A new method of obtaining topography-free electrochemical SECM images is demonstrated on a corroding sample. This feature of the M370 allows a user to access the surface electrochemistry of samples that were previously impossible to measure using standard constant- height SECM area-scan techniques.
The combination of OSP and SECM techniques are demonstrated on a corroding weld with millimetre topography while maintaining close probe-sample proximity. The experiments were performed on both biased and unbiased samples, and demonstrate defined areas where the weld is actively corroding. The current variation measured over these areas due to Fe(II) oxidation varied between +5 pA and -114 pA.


