

Instrument & Quartz Crystal Microbalance (QCM) coupling: Mass measurement during polypyrrol film deposition Electrochemistry – Application Note 13
Latest updated: January 31, 2024Abstract
This application note presents experiments performed using a QCM coupled to a BioLogic potentiostat. The mass uptake during the electropolymerization of pyrrole was monitored by the QCM simultaneously to current and potential, measured by the potentiostat. The resonant frequency change was measured using the auxiliary analog output of the QCM and the analog input on the BioLogic device. The QCM output voltage signal is automatically converted into a resonant frequency change.
Introduction
Research advances and trends towards studies in the sphere of nanotechnology is driving researchers towards increasingly more efficient analytical methods.
Using a single technique, within a single scientific field may no longer be sufficient to identify and describe a whole system. Especially for bioelectrochemical systems, it becomes essential to have more than one analytical technique to understand the mechanisms of the reaction.
Our potentiostat/galvanostat product range is designed to be able to record external analog signals collected by another instrument. Our instruments are provided with 2 auxiliary analog inputs. The instrument records two analog voltages as auxiliary signals. A specific menu in EC-Lab® software is made to configure the recorded signals in terms of label and unit to be the same as the original signals measured by the external device.
The experiment chosen for this coupling is a polymerization of a polypyrrol film with electrochemistry (cyclic voltammetry) and the simultaneous follow up of the increasing polymer mass on a Au quartz using a SEIKO EGG QCM Model 922 (resonant frequency: 9 MHz).
The Quartz Crystal Microbalance (QCM) is a mass-sensitive detector based on frequency changes of an oscillating quartz crystal. The oscillation of the crystal at a frequency is proportional to the mass of the crystal, as well as solution properties near the surface (including viscosity, density, temperature, and compression waves). A mass increase results in a frequency decrease. Sauerbrey first provided a description and experimental verification of the mass/frequency relationship between foreign layers firmly attached to the quartz crystal resonator [1,2]. In the 1980s, the applications of the QCM were extended to liquids [3,4].
The aim of this note is to describe the feasibility of the coupling between our potentiostat and an external device such as a quartz crystal microbalance (QCM922).
Experimental Part
Electropolymerization
The polypyrrol film was coated on an Au quartz (used as the working electrode) using cyclic voltammetry (20 cycles). The quartz electrode was bulked in an acetonitril solution (Bu4NPF6 0.2 mol·L-1) containing 1‑methyl-pyrrol monomer with a concentration 10-2 mol·L-1. The potential sweep was used instead of a polymerization in potentiostatic mode in order to obtain a smooth film. The potential sweep was performed from 0 V to 1.018 V vs. Ag/AgCl with a 100 mV/s scan rate. We used a three electrode cell for the experiment with Au quartz as a working electrode, a platinum wire as a counter electrode, and a Ag/AgCl electrode as a reference electrode.
Mass Variation Measurements
The resonant frequency and resistance variation measurements were performed at the same time as the cyclic potential sweep in order to avoid a time discrepancy between the potential sweep and the frequency and resistance recording. At the beginning of the experiment, the QCM’s initial frequency and initial resistance (corresponding to the quartz oscillation in the bulk solution) have to be initialized as the default values. The user must select a frequency range and a resistance range for the QCM (refer to the QCM922 user’s manual for more details). In this experiment, the selected ranges were ±20 kHz for frequency and ±2 kΩ for resistance. The quartz crystals used were 9 MHz AT-cut resonators, mirror polished (0.5 µm) with 300 nm gold sputtered on Ti. The gold electrode area deposited on the crystal was 0.198 cm²
QCM Input Signal Configuration in Ec-Lab®
EC-Lab® software contains a configuration window for external devices. This window offers the ability to configure two input voltages that may be sent by the external device to the potentiostat during the experiment.
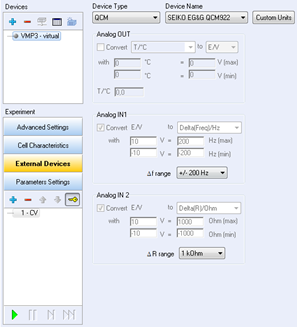
Figure 1: External device configuration window.
The configuration of this window begins with the channel selection, the choice of the device type, and the device name. Once these parameters are selected, the analog inputs are automatically configured by the software. Nevertheless, the user should check for the variables and scale defined for each analog input signal.
In “Device Type”, select QCM and QCM922 as “Device Name”. The Analog Input 1 is now calibrated to record the frequency variations in Hertz. The default frequency range is 20 kHz, and the default resistance range is 2 kΩ. In these conditions, the entire potential range ([0-10] V) is calibrated for the entire frequency or resistance range.
Results and Discussion
Polypyrrol Film Growth on the Quartz Working Electrode
Figure 2 below presents the polypyrrol film growth on the quartz electrode during the successive cycles of cyclic voltammetry.
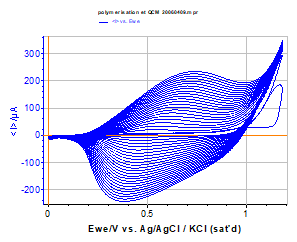
Figure 2: Polypyrrol film growth on the Au quartz electrode during successive cycles in a Bu4NPF6 0.1 mol·L-1 solution containing 1e-2 mol·L-1 of Methyl pyrrol, (v= 100 mV/s), 25 cycles.
The reversibility of the charge transfer in such a polymer film is often deposition mode-dependent (quasi-reversible in this example). The growth is very regular, but tends to slow down in the last cycles. This can be due to an impoverishment of the solution in methyl pyrrol species in the layer close to the electrode surface and to a saturation of the working electrode surface area.
The first cycle shows clearly the beginning of the oxidation peak of the methyl pyrrol monomer at 1.16 V vs. Ag/AgCl.
QCM Measurements During the Film Growth
Figure 3 shows the direct display of the resonant frequency and resistance variations versus time recorded by the potentiostat the same time as current and potential. This recording is possible thanks to the previous external device configuration described on Figure 1.
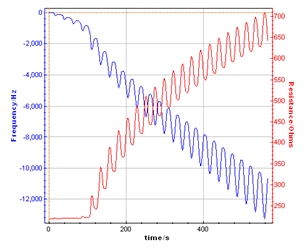
Figure 3: Resonant Frequency and resonant resistance response recorded by the potentiostat during the polypyrrol film growth on the Au quartz electrode.
This graph shows the resonant frequency decrease and the resonant resistance increase while the polymer film is growing. Moreover the variation is dependent on the potential sweep resulting in a pseudo oscillation of frequency and resistance related to the successive cycles. This plot can also be made versus potential (Fig. 4).
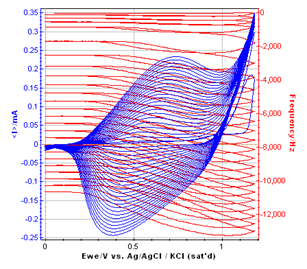
Figure 4: Overlaid frequency versus EWE and cyclic voltammetric curve of the polymer film growth.
It is worth following the frequency evolution versus potential on one cycle. The figure below shows the time evolution for one cycle.
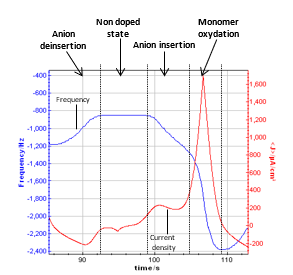
Figure 5: Graphic zoom on one cycle showing the resonant frequency and the current density.
According to several papers reporting the resonant frequency variations with the potential sweep, it can be assumed that a plateau on the resonant frequency corresponds to the non-doped state of the polymer. It seems to be between 0 and 0.2 V vs. Ag/AgCl. When the potential begins to increase (from 0.2 to 0.8 V vs. Ag/AgCl), the frequency decreases with a constant slope. It corresponds to the oxidation of the polymer, which is related to the insertion into the polymer of electrolyte negative ions to keep the electroneutrality.
Then, the frequency decreases with a higher slope from 0.8 V to the vertex potential (1.18 V vs. Ag/AgCl) and back to 0.8 V vs. Ag/AgCl. In this potential range, the monomer (methyl pyrrol) is oxidized, resulting in the growth of the polymer film. The slope of the part of the resonant frequency curve is more important than the previous one, and it increases with the cycle number.
From 0.8 V to 0.2 V vs. Ag/AgCl (reverse potential sweep) the polymer film is reduced to reach an undoped state. During this step, the negative ions are deinserted from the film, and the mass of the polymer decreases, resulting in an increase of the resonant frequency. These phenomenon are widely studied to understand the anion insertion-deinsertion into conducting polymer films [5-7]. It is commonly assumed that the mass of the polymer is determined on the plateau for an undoped state.
Mass Calculation Using EC-Lab® Software Process
A mass process is available in EC-Lab® software in order to calculate the quartz mass variation automatically. Display the raw data file. In the Analysis menu, select “Process data”, and the process window is displayed.
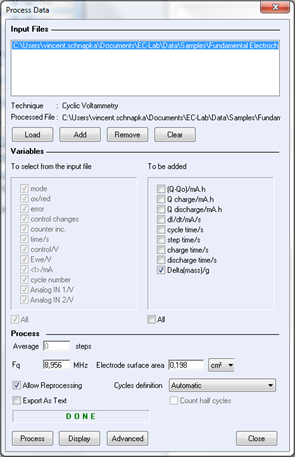
Figure 6: process window for mass calculation.
On the process window, the user must define the resonant frequency used for the experiment (obtained by calibration) and select “Delta (mass)” for calculations. Click on “display” to show the mass variation on the graph.
A processed file is generated during the mass calculation (*.mpp). It is assumed to consider the electro-deposed mass of polymer in the neutral state in the voltage range [0; 0.2 V vs. Ag/AgCl], i.e. when the frequency is back to the minimum value.
Conclusion
The results presented above show the coupling feasibility of a quartz crystal microbalance QCM922 with one of our potentiostats. An external device configuration has been especially designed for both the QCM922 coupling and the mass variation calculation. Our potentiostats with two analog inputs can record and store the frequency and resistance values sent by the QCM922 in the raw data file. The values are plotted in the graphic window.
The analog potential values sent by the QCM922 are automatically converted by the software in frequency and resistance following a conversion ratio defined by the user and according to the selected ranges.
Such a coupling can be easily made by the user and does not require any additional modules on the potentiostat or in the software.
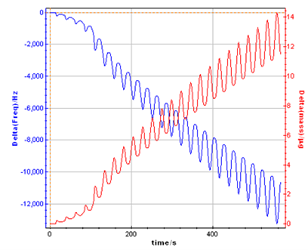
Figure 7: Mass variation calculated from the raw data file.
References
- G. Sauerbrey, Phys. Verh., 8 (1957) 113.
- G. Sauerbrey, Z. Phys., 155 (1959) 206.
- T. Nomura, M. Okuhara, Anal. Chim. Acta, 142 (1982) 281.
- K.K. Kanazawa, J.G. Gordon, Anal. Chim. Acta, 175 (1985) 99.
- W. Paik, I.-H. Yeo, H. Suh, Y. Kim, E. Song, Electrochim. Acta, 45 (2000) 3833.
- M. Skompska, M. A. Vorotyntsev, J. Goux, C. Moise, O. Heinz, Y. S. Cohen, M. D. Levi, Y. Gofer, G. Salitra, D.
- Aurbach, Electrochim. Acta, 50 (2005) 1635.
- C. Debiemme-Chouvy, H. Cachet, C. Deslouis, Electrochim. Acta, 51 (2006) 3622.
Revised in 07/2018


