
Differential (Incremental) Capacity Analysis (DCS & DCA) Battery – Application Note 40
Latest updated: January 31, 2024Abstract
This Application note is an extension of AN#2 that discusses the breadth of information that can be obtained via the PITT experiment. This note discusses how similar information can be obtained indirectly from a standard galvanostatic charge-discharge experiment. EC-lab software offers processing tools that allow extraction of dQ/dE vs. E (aka dQ/dV vs. V) data and analyzing the charge-discharge plots in the context of material phase transitions, and in particular solid solution vs. two-phase (or multi-phase), electrochemical mechanisms observed in battery materials.
Caution has to be exercised when drawing conclusions. A three-electrode cell is best suited for such experiments because in a two-electrode cell, phase phenomena occurring at both electrodes will interfere with each other and be compounded in a single graph.
Introduction
In recent years, increased interest and investment has been dedicated to the development of lithium-ion batteries.
These batteries are widely used in portable electronic devices and show promise as alternative power sources to the Nickel Metal Hybrid batteries commonly used in hybrid electric vehicle applications.
The Li-ion battery technology offers a high voltage, high energy density and long cycle life. However, like all rechargeable batteries, the use (charge and discharge) of these batteries leads to a degradation of its performance (battery capacity, structural stability, cycle life and safety).
In order to understand the degradation and the loss of capacity of Lithium-ion batteries, numerous studies have been performed over the last decade [1-8]. These studies have linked battery degradation with mechanical, chemical or structural modifications of the electrodes material during the charge /discharge process.
The degradation results in an increase of internal resistance, a decrease in capacity and an increase of the battery’s self-discharge .
Battery degradation and its origin can be studied using a new battery analysis tool available in the EC-Lab® battery process : “Incremental Capacity Analysis” (ICA) or “Differential Capacity Analysis” (DCA). This process, available since EC-Lab® 10.21 (May 2012), highlights the phase transitions of electrodes after cycling. Cycling is usually carried out at low rate (i.e C/24).
The “differential capacity” curve is obtained by differentiating the capacity Q vs. voltage E. It is defined in the equation below
$$\frac{Id\ QI}{dE}=\frac{IQ_t-Q_{t-1}I}{E_t-E_{t-1}} \tag{1}$$
Where, Qt, Et are capacity and voltage values measured at a given time t.
Qt-1, Et-1 are capacity and voltage values measured at a previous time t-1.
Experiment
Commercial 2.5 A·h LiFePO4 batteries were charged/discharged at a constant current of C/25 rate between 3.6 V and 2.0 V using a GCPL technique at room temperature.
The charge/discharge process was performed on a MPG2 battery cycler unit with EC-Lab® 10.21 software.
The charge-discharge procedure was performed as follows:
- Full charge of the battery (up to 3.6 V) before the start of the experiment.
- Discharge at C/25 rate until 2.0 V is reached. The potential was recorded every dE1 and the recording time parameter dt1 was disabled (set dt1 = 0).
- Charge at C/25 rate until 3.6 V is reached. The potential was recorded every dE1 and the recording time parameter dt1 was disabled (set dt1 = 0).
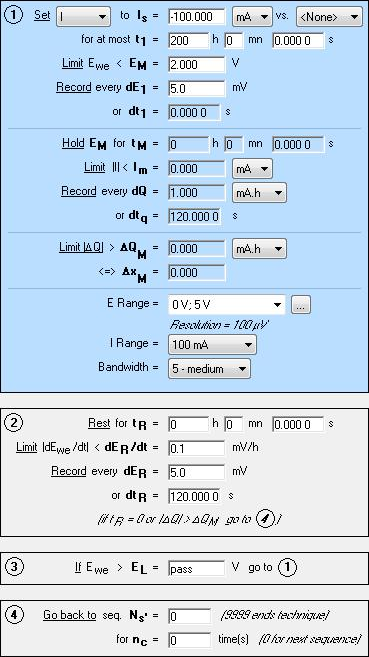
Figure 1: GCPL set up for battery cycling (only the discharge sequence is shown).
Results
The charge and the discharge of the 2.5 A·h battery are illustrated in Fig. 2 below.
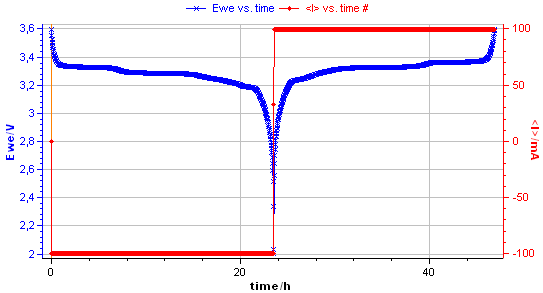
Figure 2: Voltage vs. time during the discharge and the charge of LiFePO4 battery.
The charge/discharge data were processed by the process data tool available in the batteries analysis section of EC-Lab® 10.21.
In the process data window, the d(Q-Q0)/dE, Q charge and Q discharge boxes were checked.
Figure 3 shows the process data window used to calculate the differential capacity dQ/dE.
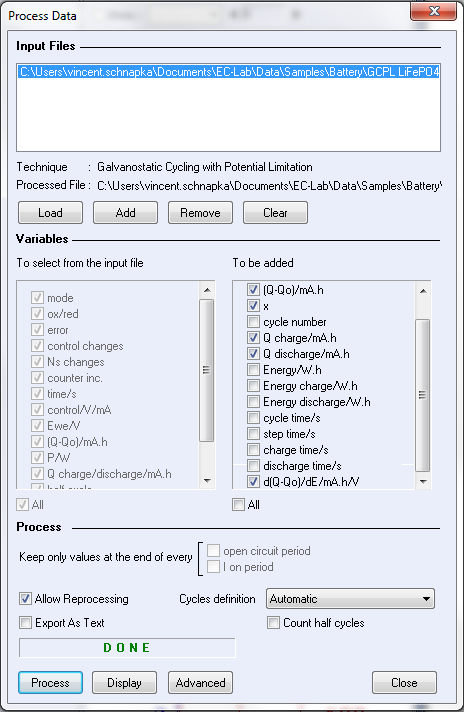
Figure 3: Process data window.
Differential Capacity curve can be plotted vs. voltage or charge Q or vs. other parameters. The main presentation of DC curves used in the literature is dQ/dE vs. E (Fig. 4a) or E vs. dQ/dE (Fig. 4b). These curves are plotted from the charge/discharge data of the LiFePO4.
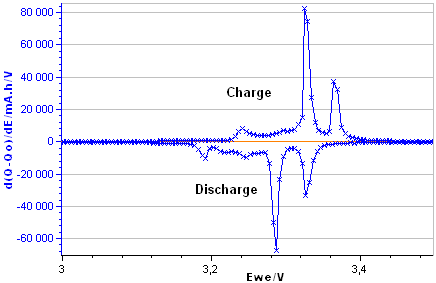
Figure 4a: dQ/dE vs. E
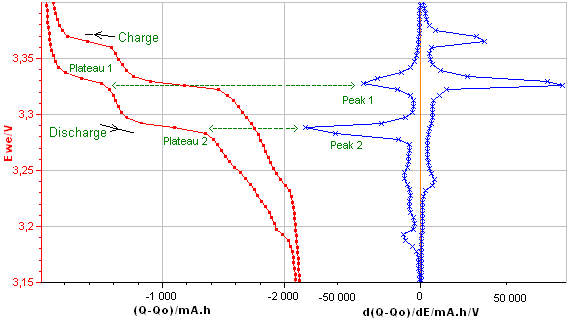
Figure 4b: E vs. dQ/dE obtained from the E vs. Q charge/discharge curve of the LiFePO4 battery.
The Differential Capacity (DC) as a function of potential gives information about structural transformations during charge/discharge process.
The advantage of the DC curve is that plateaus in the E vs. Q charge curve can appear as clearly identifiable peaks in the dQ/dE vs. E curve. These peaks are associated to phase transitions of the electrode material.
The curve in Figure 4b shows four main peaks: two peaks during the discharge (left peaks) and two during the charge (right peaks). Each peak corresponds to a flat plateau in the voltage versus charge curve indicating the coexistence of two phases in each plateau.
The appearance of the cathodic and the anodic curves gives information about the reversibility of the electrode reaction.
Plotting differential capacity dQ/dE versus cycle number allows the observation of any change (amplitude, width etc.) in the peaks from one cycle to the next and can help detect degradation over long test cycles.
Conclusion
The Differential (Incremental) Capacity Analysis (DCA or ICA) process recently introduced in EC-Lab® provides a fast and a powerful tool that allows a good understanding of the mechanisms and the kinetics of intercalation-electrode material degradation.
This degradation could be associated to side reactions or to reactions occurring inside the electrode material.
The DCA tool transforms the voltage plateaus on E vs. t/E vs. Q curves into clearly identifiable peaks. These peaks, mainly associated to phase transitions of the electrode material are easily exploitable.
Data files can be found in :
C:\Users\xxx\Documents\EC-Lab\Data\Samples\Battery\ GCPL100mAch3dE5mV_03IQ_DCA
References
1) R. Jungst, G. Nagasubramanian, H. Case, B. Liaw, A. Urbina, T. Paez, D. Doughty, J. Power Sources, 119-121 (2003) 870.
2) M. Dubarry, V. Svoboda, R. Hwu, B.Y. Liaw, J. Power Sources, 165 (2007) 566.
3) G. Amatucci, J. Tarascon, J. Electrochem. Soc., 149 (2002) 31.
4) H. Wang, Y. Jang, B. Huang, D. Sadoway, Y. Chiang, J. Electrochem. Soc., 2 (1999) 146.
5) Ch. Peabody, Craig B. Arnold, J. Power Sources, 196 (2011) 8147.
6) A. J. Smith and J. R. Dahn, J. Electrochem. Soc., 159 (2012) 290.
7) A. Smith, PhD Thesis, Dalhousie University, (2012) 67.
8) M. Dubarry, V. Svoboda, R. Hwu, B.Y. Liaw, Electrochem. Solid-State Lett., 9, (2006) A454.
Revised in 08/2019